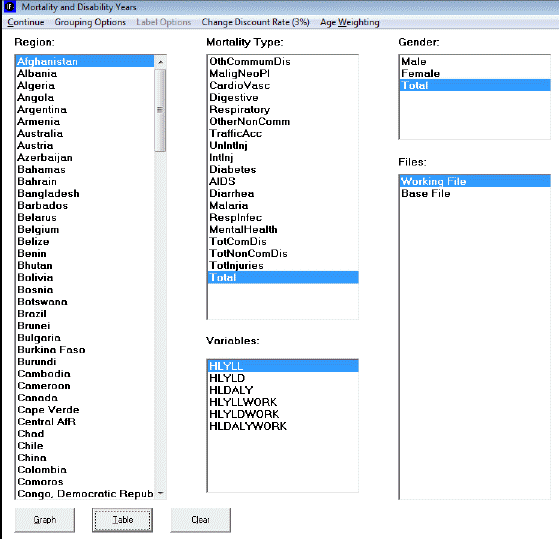
Mortality and Disability Years is a feature found on the Specialized Display sub-option of the Display Option on the Main Menu. This feature allows the user to forecast mortality from various causes while calculating a discount rate, set by the user. Specifically, the user is able to forecast the number of years of life lost because of a given mortality type, and the years of living with a disability due to contracting a mortality type.

The use of this feature is similar to other features in the IFs program, such as Flex Packaged Display. While the wide array of features that the IFs program offers may overwhelm those who are just beginning to use the program, they can perhaps take comfort that similarities are found in how the features are used.
The first step to using this feature is to select a region to display from the column on the left-hand side of the screen. Countries are listed in the region column by default, but the user is able to display groups, decomposed groups, or g-lists under Grouping Options, found at the top of the screen.
Next, select the mortality type and which gender to display.
Then, select the Variables to display: either Years of Life Lost (YYL), Years of Living with Disability (YLD), or Disability Adjustment Living Years (DALY). DALY is calculated by adding together YYL and YLD, so that YYL + YLD = DALY. Selecting the variables that end in the suffix WORK will limit the years lost to only working years, instead of total years.
The next steps that the user should take are found at the top of the screen. The user should consider at what percent to set the discount rate. Simply put, the discount rate is often used to estimate the time value of money- that is, the value of a given sum of money over time relative to a base year. Assuming that having money is better presently than in the future, the diminished worth of the future money is estimated by ‘discounting’ the money by a percentage for every year into the future. For instance, with a discount rate of 4%, $100 at year 1 is worth $100. At year 2, however, that $100 is worth $96; at year 3, $92.16; at year 4, $88.47, and so on. The percentage is set at 3% by default, but the user is able to adjust the percentage.
The user is now ready to display the result of the previous steps in the form of a graph or table. Note, however, that the discount rate or display options cannot be changed while a graph or table is open. Close the open application, and then adjust the discount rate or display option. Then the recalculated data can be displayed in a table or graph.