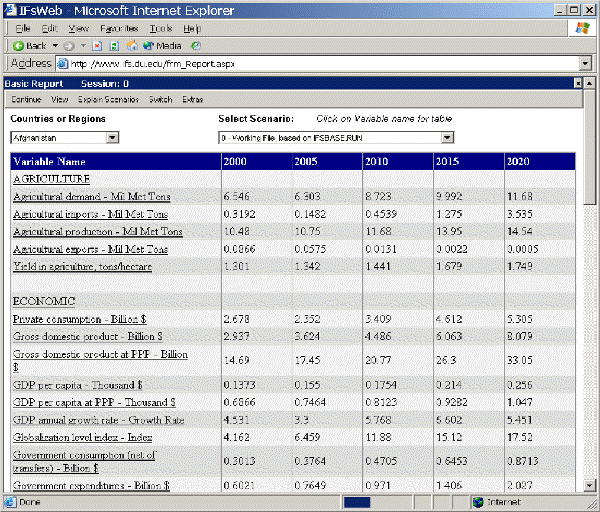
The Basic Report can be found as a sub-option under Display on the Main Menu. This display option of IFs allows users to view information for a country or group organized into broad categories. As the name suggests, this display feature presents a basic report of a range of important variables for selected countries or groups.
A sample Basic Report (below) shows you a selection of variables from the model in key issue areas. The image below is for Afghanistan, in the default view.

Users can organize and display the information in the Basic Report in a number of different ways. By selecting the Switch option from the Basic Report menu and then the Use Groups toggle, users have the ability to aggregate data (or disaggregate data if they decide to toggle back to Country/Region selection). Additionally, from the Switch option on the Basic Report menu, users of IFs can toggle between Report 1 and Report 2. These two reports differ in the variables that are organized for display purposes. The broad categories that organize these variables remain the same. Toggle between Report 1 and Report 2 to see which you find more useful
Users can also change the way in which data is displayed in the table. The sub-options under the View selection allow examination of percentage changes from the initial year or the percentage difference between a selected Run-Result-File from the base case. Click on View and then on Percent Change From First Year. If you are set on the year 2000, you will see that all of your numbers change to 0. If you move from there, you will be able to see whether variables are forecasted to grow or shrink comparable to the base year. Next, select Percent Change from Base Case and, from the Select Scenario scroll-down menu, choose a Run-Result-File that is not the Base Case or the Working File. The data will now be displayed as a percent change from the Base Case to the Run-Result-File that you have chosen for each data display.
Identify a variable of special interest to you in a grid table of the Basic Report (such as Agricultural Demand – Millions Metric Tons). Double-click on the variable name. That will call up a table of the variable over time. The table will have at least two columns. Each column header will show the name of the variable for a particular Run-Result-File of the model or scenario, and the number in brackets after the variable name identifies the Run-Result-File. For instance, the number 1 always identifies the Base Case. (The Explain Scenario option on the Basic Report menu can explain more about file numbering). With the table on your screen, select the Graph option and the Bar graph option to see how to create a bar graph of this variable. Learn more about graphing options and tables in IFs.
The Explain Scenario option located on the Basic Report menu allows users to understand what changes compose different Run-Result-Files. By selecting a Run-Result-File from the Select Scenario scroll down menu, it then automatically loads into the Basic Report. When you have loaded a Run-Result-File that you are interested in, click on Explain Scenario and then Explain Selected Scenario. This will bring up a new screen that details all of the changes made to the Base Case in order to create this Run-Result-File. Also, click on Explain File Numbering to understand why Run-Result-Files are numbered differently.
Finally, some of the options on the Basic Report may be under development and therefore may not be accessible.