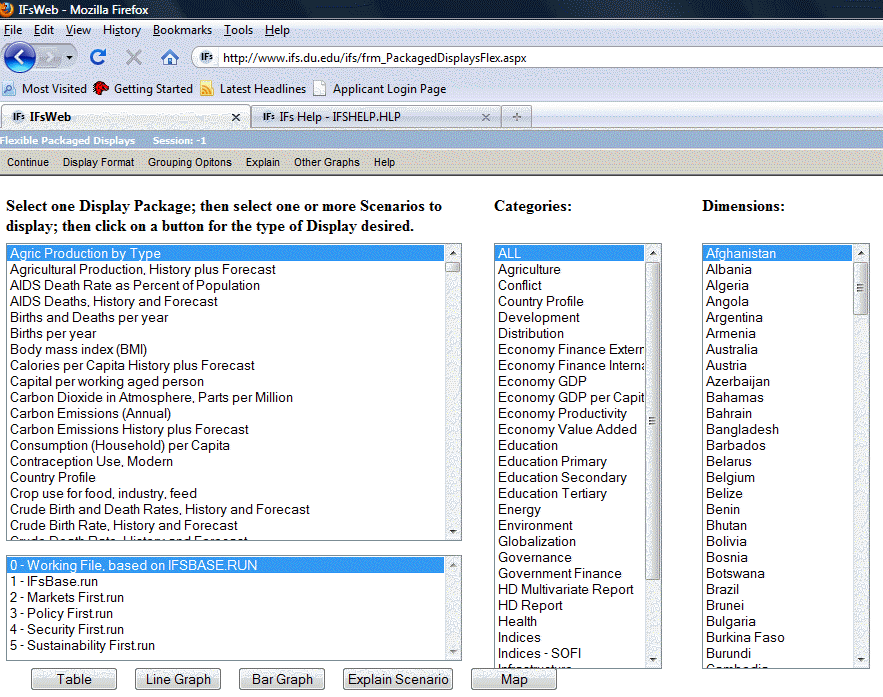
The Flex Packaged Display can be found under Display on the Main Menu.
This display feature of IFs allows users more flexibility than the Packaged Display by allowing for the display of data sets by specific country or group.

The Flex Packaged Display is designed to allow users to graph information on a specific country/region or group. The display variables are located in a list on the left hand side of the screen. To the right of this list of variables is a list of general categories. Each display belongs to one of the broader categories. If the user is interested in one specific category, click on it and the general list of displays will be reduced to only those that pertain to the selected category.
To the right of the general categories is a list of dimensions in which the categories are displayed. The default dimension is the countries for which IFs has data. If, instead of displaying countries/regions, you would like to display countries/regions, groups, decomposed groups, or G-Lists, simply click on the corresponding option under the Grouping Options on the Flex Packaged Display’s Main Menu.
The list at the very bottom of the screen is of the different Run-Result-Files that accompanied the online version of the software. To learn more about specifically what parameters and variables are affected by these Run-Result-Files, simply highlight one and click on the Explain Scenario button.
The user is also able to select more than one country or more than one Run-Result-File for graphing. Simply click on one country/region, hold in the control button (ctrl), and click on another country/region. Do the same to see a graph displaying results as the product of more than one Run-Result-File.
When the user has chosen the display to graph and the countries/regions or groups that to display, click on Line Graph or Bar Graph or on Map. The user is also able to create a radial graph by selecting the feature listed under the Other Graphs option in the heading.
The Display Options and Explain options, located in the toolbar at the top of the screen, contain several features that allow the user to customize the output of the Flex Packaged Display.
Set Title, Display Interval, or Year: This feature mainly applies to the outputs for tables and graphs. The user is able to select the year displayed in the map, the year interval for tables, and the titles for tables and graphs. The user can also label the titles for X and Y axes for graphs.
Currency: This feature allows the user to select a currency other than that of US dollars. Simply select the currency country name, the currency symbol, and the currency value in US dollars. Use the website listed on the page to determine the current value of the currency. Then select whether to display US dollars per unit of currency, or the currency per unit of US dollars.
Horizon: This Display feature allows users to alter the time horizon for which they would like to display. It includes two sub-features. The first is Display Run Horizon: This allows users to select the time horizon they would like to display. The second is Run File Horizon Choice: When users are using multiple files, this option allows displays to be either of the shortest time horizon among the files being used or the longest time horizon.
Use estimation to complete data: Some of the historical data tables used in IFs have missing data. This option allows the user to estimate the values for the missing data. Alternately, selecting Use all available Historic Data will not use estimated values to fill in for missing data.
The Explain List in the heading is an option that, when selected, will provide a definition, show the historic formula, and list any dimensions available for any selected variable.