 International Futures at the Pardee Center
International Futures Help System
Cross-Sectional Scattergram
This section describes how to use the various features on the Scattergram, which appears after clicking the Plot button in the Analyze Across Countries (Cross-Sectional) option.
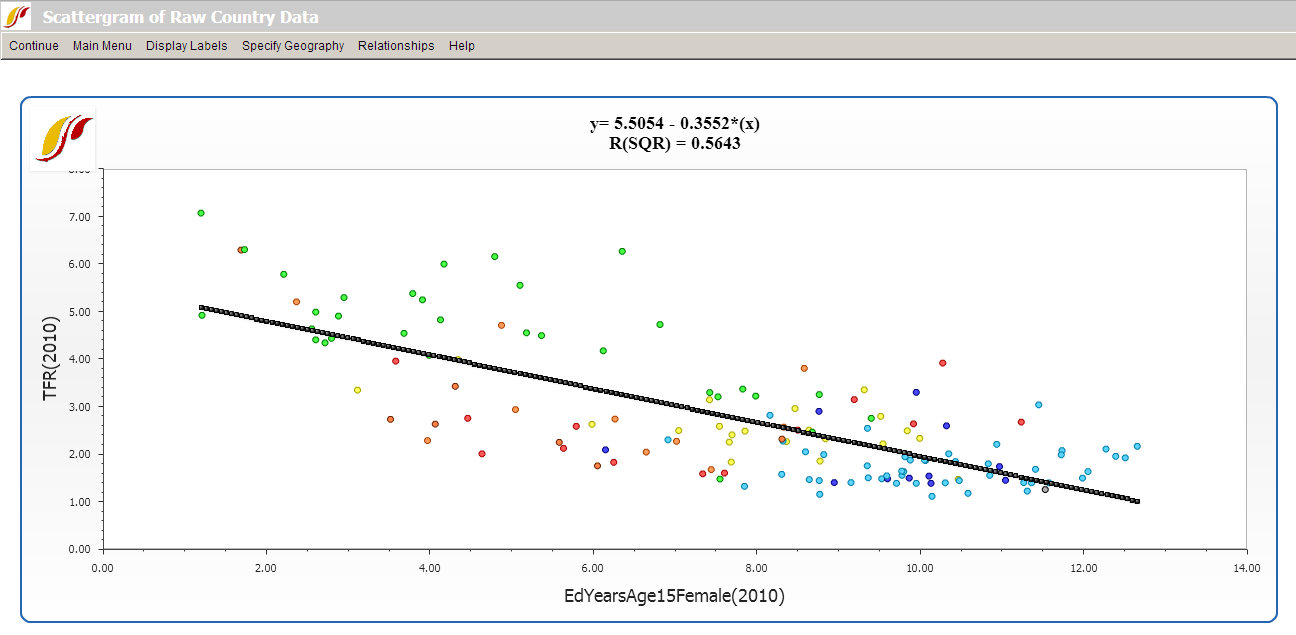
The Relationships option allows users to fit a line to the graph. To impose a line of relationship on the scatter plot as displayed above, choose Relationships from the toolbar, and the option Linear. Notice the r-squared value (a measure of the goodness of fit between the independent and dependent variable) and linear equation displayed at the top of the screen. Additional relationship types include: logarithmic, exponential, power, polynomial and logistic. To remove the line, click on No Regression.
The Display Labels feature allows users to change the labels on the graph. The default selection is No Labels. Although the country names are not shown on the graph with this setting active, users are able to see them by hovering over the data points on the plot area. By switching options under the Display Labels menu, countries can be represented by the full names or the abbreviations of the names instead. Users can also fully customize the labels of the x- and y-axes, the title, and the subtitle of the graph.
Alongside Display Labels, the Specify Geography menu option allows the user to display data by country, group, or geographic list.
Clicking on Continue returns the user to the previous page.