 International Futures at the Pardee Center
International Futures Help System
Poverty Level Display
This feature can be accessed from the main menu of IFs by clicking on Display, then Specialized Displays for Issues and then Poverty Level Display.
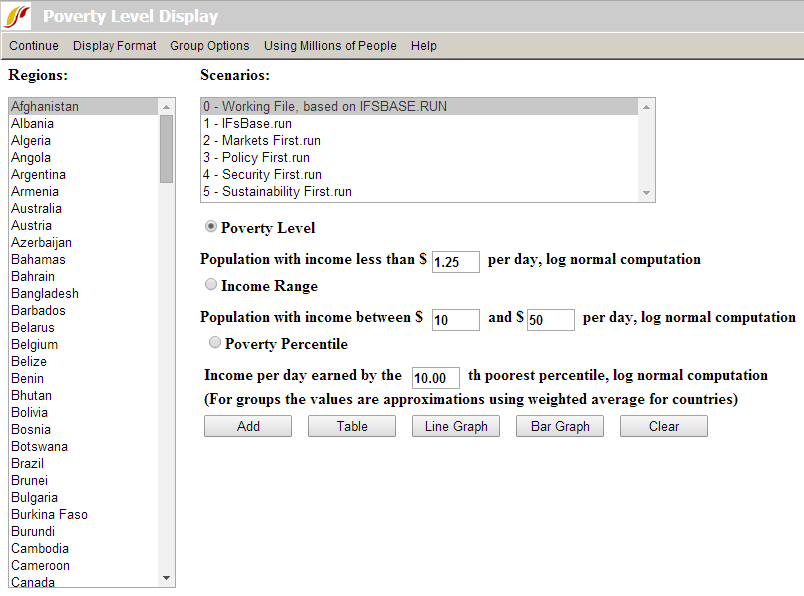
This display is useful for visually displaying forecasts of the number or percentage of people who live below a daily poverty level that you can specify with great flexibility. You can also specify an income range and see the number or percent of people within that range, for instance to assess the size of the middle class over time. Further, you can select a percentile share of the population (e.g. the poorest 10 percent which is the default), and see over time the income that defines the level below which that population segment lives. The three radio buttons in the center-right of the form choose which of those displays you want to see and allow you in their boxes to specify the associated values. When either the first or second radio option is specified, a menu option appears that allows you to toggle between looking at the number of people or the percentage of a population.
The form has default options for geography (Afghanistan), scenario (the Working File), and the radio button (Poverty level at $1.25 per day (Using Millions of People). Basic use of the form involves keeping or changing any of these options, touching the Add button (which places this and perhaps other selections in a status box) and then touching the desired display format button (Table, Line Graph, or Bar Graph).
More extended options are available on the menu. Under Group Options you can change the geographical options from countries/regions to Groups, G-Lists, or Decomposed Groups. Display Format sub-options allow you to change elements of displays such as the title of graphs or the display interval of tables and bar graphs. You can also change time horizon for displays.