 International Futures at the Pardee Center
International Futures Help System
Bivariate Functions
Begin at the Main Menu of IFs. Choose the Change Selected Functions option under Scenario Analysis. Then choose the Bivariate Functions sub-option. That will give you the Change Bi-Variate Functions window, below.
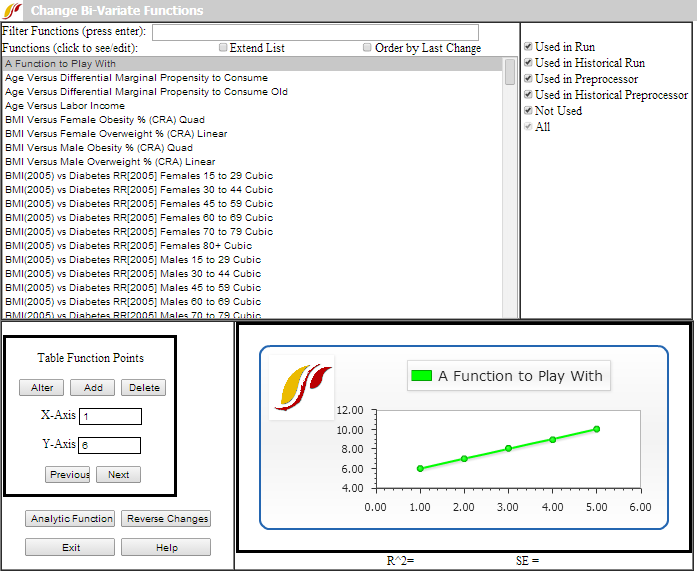
To see the full list of functions or relationships that you can change in IFs, check Extend List. Click on any of the function names (relationships) in the Functions list box in order to see the relationship already in IFs. When you click a graphic of the function will be displayed in the lower right of the window. Many of the functions will also display the r-squared and standard error (SE) that indicate the strength of the relationship that we found when creating it via cross-sectional analysis of our database.
Our creation of the functions was sometimes to use in computations of the model run from the base year, sometimes to be used in the historical run, and sometimes in the model's data preprocessor to fill holes and clean up data (again, for either historical forecasts or those looking forward). The options in the upper right are all checked by default, but if you wanted to see only those functions used in the model run, you could turn off all of the other checks. This window actually gives you the opportunity to revise the functions used in the model run.
There are two ways to specify (and therefore also to change) relationships in IFs. The first is called a "table function." Table functions allow you to specify two or more points in a relationship and let IFs connect those points with lines to create the relationship. This is a very simple process because you need not understand equations; but it also allows the creation of complex functions. The second is via "analytic functions" or equations. Look at each in turn.
Option A for Specifying Relationships: Table Functions. Click on the "A Function to Play With" relationship so that you can do just that. In the Table Function Points frame, you see boxes for specifying new or changing old X-axis and Y-axis values. Let's start by adding a point to the five that already make up the table function. Specify 7 as the X-axis value and 8 as the Y-axis value. Touch the Add button and the point will be added, creating a relationship between X and Y that increases to a point and then starts down. Try specifying 1 as the X-axis value and 8 as the Y-axis value, then touching the Alter button. Now you have a relationship that starts downward, climbs, and then drops. Table functions give you nearly unlimited control over the form of a relationship. You can always touch Reverse Changes to return to the original form. As it says, play around.
Option B for Specifying Relationships: Analytic Functions (Equations). Click again on the "A Function to Play With" relationship. This time, however, touch the Analytic Function button in the lower left to call up the following screen.
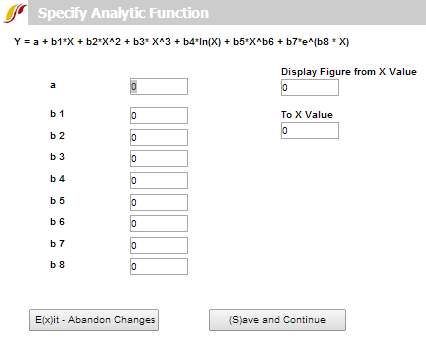
If you do not understand equations, you may want to skip this part of the lesson – table functions can serve you well. But you can create a simple analytical function by specifying the constant (a) as 20 and the logarithmic parameter (b4) as 3. Leave the other parameters at 0. Note that by selectively specifying various parameters you can create a wide variety of analytic functions (including most of those that Excel will create when you fit lines to scatter plots). You may also specify the lower and upper range over which you will allow the independent variable to vary. For instance, you may not want the independent variable to be negative.
Save and Continue returns you to the Change Functions window and displays the analytic form you have specified. Note that the function you have created looks much like the one that Excel fit to the relationship between GDP per capita and life expectancy in Lesson 4 . You now have the capability of discovering relationships and good analytic representations of them using the cross-section analysis capability of IFs or Excel with the IFs database or Excel and then taking those relationships into IFs itself.
When you Exit from the Change Functions window, IFs gives you a very important informational warning. If you have made any changes to functions, those will remain active only until you exit from IFs. Starting IFs again resets all functions to standard values. Moreover, although runs of the model that you make with altered functions will reflect your changes, no information about the changed functions is saved with the .RUN files. You must keep track of the changes you make in functions.
After you have changed one or more functions, you can run the model and create a new working file that reflects the changed functions and their impact on all computations in IFs. You can compare that working file (or a saved version of it) with the Base Case or with other scenarios.