 International Futures at the Pardee Center
International Futures Help System
Mortality by Age, Sex and Cause
Mortality by Age, Sex, and Cause is located as a sub option of Specialized Displays for Issues, which is in turn located under the Display option on the main IFs page. The Mortality by Age, Sex, and Cause option is also found in the Main Menu Map Pop-up options, a pop-up box shown after a click on a country from the map on the Main Menu window.
The Mortality by Age, Sex, and Cause option shows the distribution by age and sex of deaths per 1000 people. From this display form, users can choose to look at the forecasted results of mortality for any countries or groups in the IFs model.
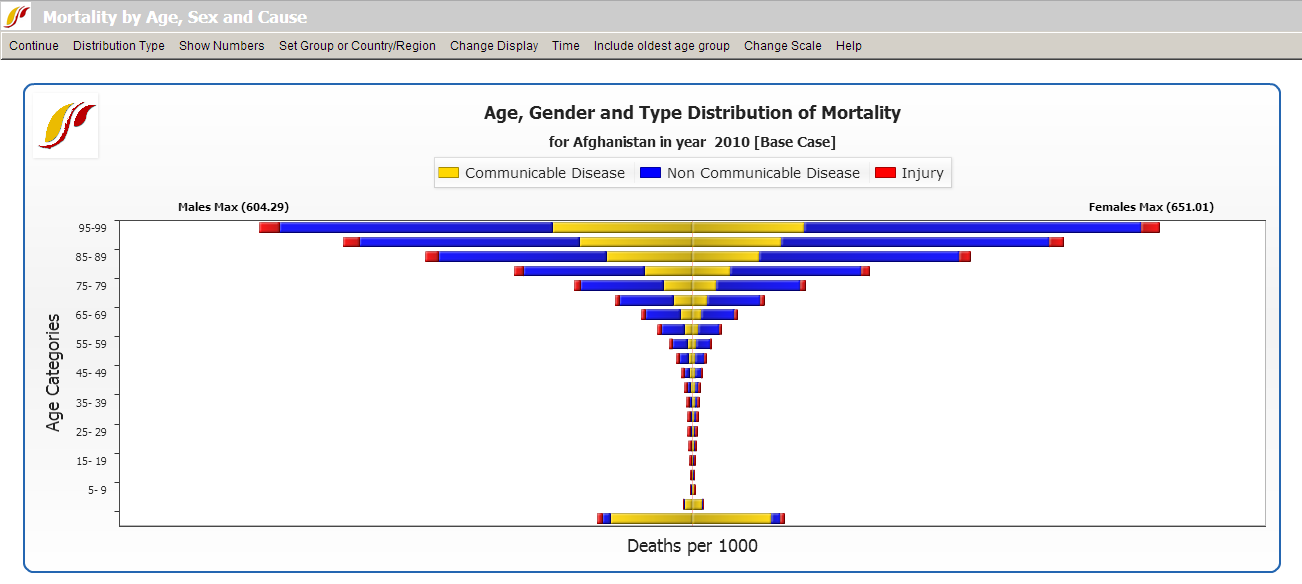
The default country for viewing is Afghanistan unless you have previously clicked on a country from the map of the Main Menu Window (doing so makes the country selected the default for subsequent use of specialized displays ). You can change the country displayed by clicking the Change Display option on the form's menu. Under Change Display are sub-options that allow users to change the year or, the country/region that is being shown. If you would like to change to displaying groups, simply click the Set Group or Country/Region option located on this specialized display's menu.
On the default display mortality is shown in three general groupings: communicable disease, non-communicable disease, and injuries or accidents, with males on the left and females on the right. The sub-options under Distribution Type allow you to change that display. Communicable Disease, Non Communicable Disease, and Injuries sub-options put the males and females on the same side of the graphic to allow easier comparison. Communicable Disease Subtypes, Non Communicable Disease Subtypes, Injuries Subtypes sub-options show more detail of mortality causes in each of those categories. The Distribution Type option also has a sub-option to Compare Countries. This allows users to display four Distributions of Mortality graphs, each with a unique country and/or year selected. Users can see how the distribution of one country is forecasted to change across time, or how one country compares to another.
Click on the Show Numbers option and select the sub-option also titled Show Numbers to display a tabulated version of the inverted pyramid display. Under the Show Numbers/Show Factors sub-option are two sub-sub options. The first, Scaling Factors are deep level information not typically of interest to most users; they are the values by which we divided our initial mortality calculations in order to match those from the World Health Organization (WHO) in the first year. The second, Normalization Factors adjusts the detailed mortality data that we have obtained from WHO (courtesy of Colin Mathers) to the total mortality values that come from the United Nations Population Division data that we use for demographics across the model.
Another option on the menu of this form is Include oldest age group. The oldest age group, typically 100+ in IFs, has an extremely high mortality rate and, if shown in the graphical displays, would make mortality patterns for younger age categories difficult to distinguish. Hence the default option is to not show that age group, but this option allows its display.