 International Futures at the Pardee Center
International Futures Help System
Analyze Across Time (Longitudinal Analysis)
Whereas cross-sectional analysis (Analyze Across Countries) concerns historical relationships between different variables, the primary purpose of the longitudinal analysis (Analyze Across Time) is to trace historical trends of individual data series. This option can be accessed from the Data Analysis option on the Main Menu of IFs.
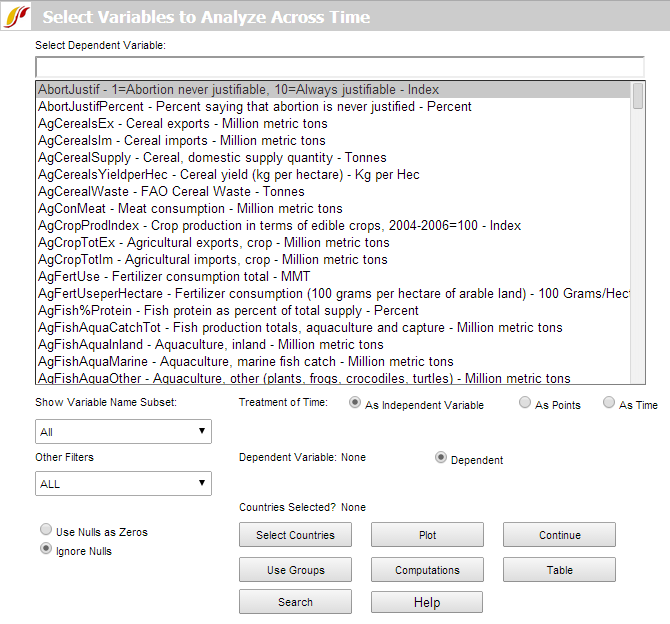
To start with, pick any data series to load a dependent variable. Time is set as an independent variable by default. Users can select a variable by scrolling through the dependent variable list box, typing a variable name in the text box or with the more sophisticated, separate Search option, located at the bottom of the screen. Click Select Countries to specify the data that will appear in graphs. (Note that Use Groups , the button beneath Select Countries, is a toggle, switching from country to group selection or vice-versa; e.g. if groups are selected the toggle will read "Use Countries"). From the country selection screen, pick a country, a group or a decomposed group. Buttons on the right side of the country selection screen also allow users to switch aggregation to groups or decomposed groups. Continue back to the original screen for analysis over time and Plot the result.
To demonstrate, pick a variable such as AidDon%GNI (aid donations as a percent of Gross National Income, the successor concept to Gross National Product). Click the Select Countries button and choose United States as a donor country. To generate the graph displayed below, click Plot. You will see the trend of U.S. aid commitment over time.
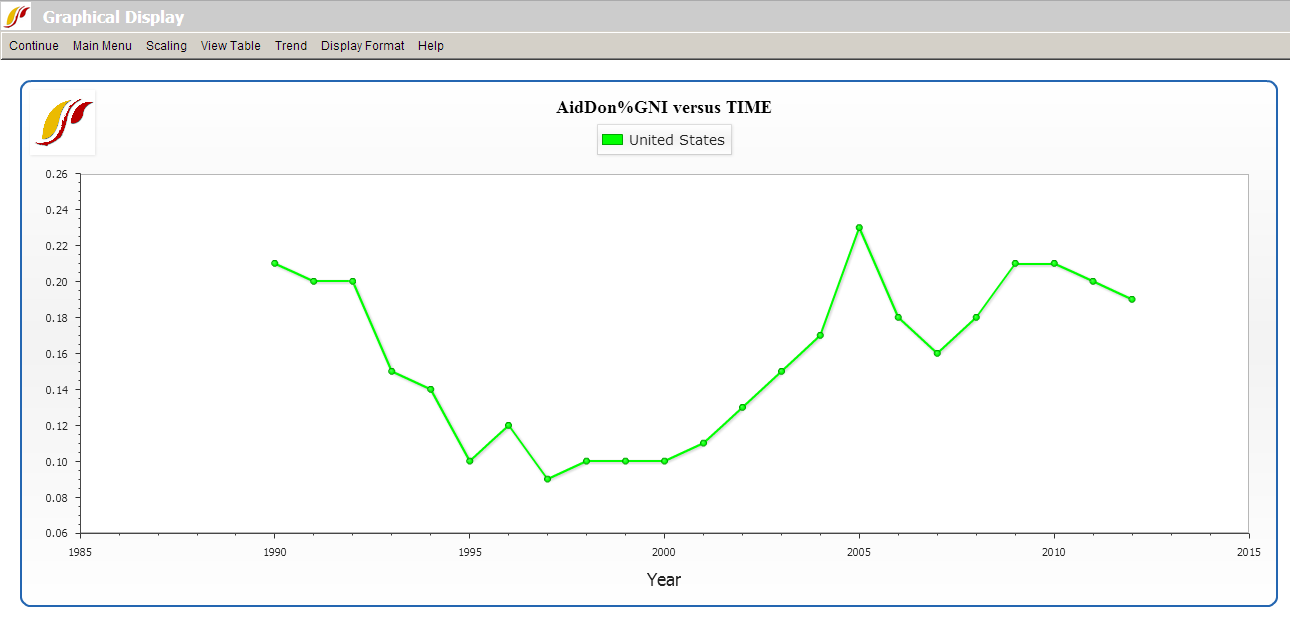
On the Graphical Display screen as shown above, options on the top menu bar allow users to go back to home screen, alter the scale, display a table, format titles and explore future trends. Under the Trend menu, users can impose extrapolations—linear, polynomial, logarithmic, exponential and s-curve—onto the chart. The sub-option, Extrapolation Setup, features customization options for polynomial, exponential and s-curve trend lines.
An additional feature of the longitudinal analysis is the ability to look more closely at the data set in which a user might be interested. Left-click on any variable and a small window with two options will appear: Select and Data Information. Click Data Information in order to access detailed information as to the scope, availability and properties of the data set in question.
Some other features of this section of IFs include the Computations button and the Table button.
Other than the default setting, treating time as an independent variable, which allows users to look at a historical trend of one variable over time, two other types of analysis are also available in the model: treatment of time As Points and As Time. When the Treatment of Time check box labeled As Points is active, the data points become years and users can look at the relationship between two variables as x- and y-axes. The third option, treatment of time as time, facilitates side-by-side comparison of longitudinal trends with two different variables on the same display (the x-axis is time, in this case).
Exploration of maps, cross-sectional and longitudinal relationships, and relationships computed for IFs can give you much information about the apparent relationships among a wide range of global development indicators. Even if you never used IFs for forecasting, this data analysis capacity could significantly enhance your understanding of the world.