International Futures at the Pardee Center
International Futures Help System
Validation
Many users will be interested in validating the IFs model. One approach to validation is the process of examining how well a model's historical forecasts compare with actual empirical data. Such comparison can be done through specific display features in the Self-Managed Display. It should be emphasized that there will be many discrepancies between historical forecasts with IFs and data for several reasons including: (1) a model run over 50 years without any correction processes (often historical analysis with models correct every year before proceeding to the next, which we do not do) will inevitably result in drift of forecasted variables from data; (2) in the years of the historical run there were many shocks to the global system (such as the energy crises of the 1970s, the movement of China to market economics and its introduction of a one-child policy; the fall of communism in the former Soviet Union and Eastern Europe) that IFs could not have anticipated. This reality should, of course, give us much humility in our forecasting of coming years.
For comparison of historical forecasts with data, users must open IFsBaseHist (sub-option Switch), located in the Self Managed (Full Variable/Parameter Selection) Display menu. Once this is opened, a new menu option becomes available called History Variable Options. The Select from Forecasted Historical Variables sub-option which allows users to choose a historically forecasted variable should be active by default.
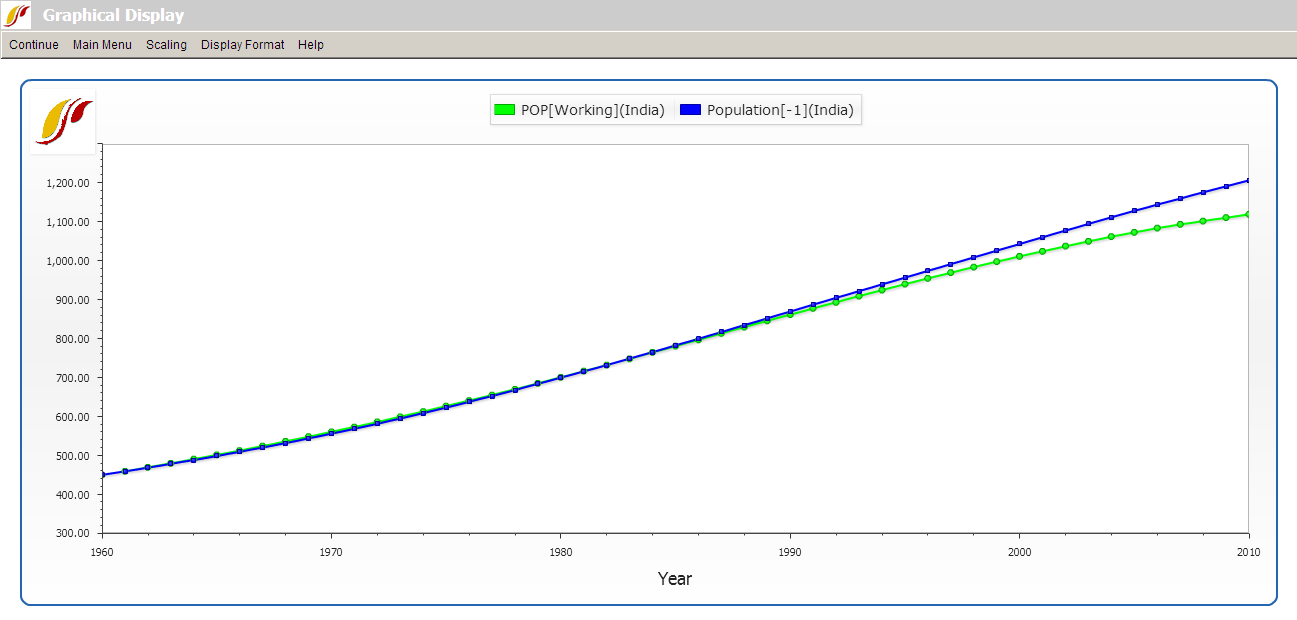
Users should first choose a variable to validate. For this exercise, choose POP . Users are then prompted to choose a country/region or other geographic units for validation. Select India. The Status Box at the bottom of the form then displays that you have chosen POP for India. Users can identify this set as (historically) forecasted data by numeric label of either 0 (working) or 1 (base).
Users should then choose empirical data to compare with the historically forecasted variable. Open History Variable Options in the menu again and click on the Select from Empirical Historical Variables sub-option. Choose the same variable, actually Population for India, to examine accuracy of historical fit of forecasts from the model. Users can note that the numeric label of this variable in the Status Box is now -1. This number denotes an empirical historical data set.
Click on Go to Display, Graph and then Line to see the degree to which historical forecasts parallel empirical data. What you produce may look similar to the graph produced below:
Another opportunity for validating the IFs model also involves opening the IFsBaseHist option from the Self Managed (Full Variable/Parameter Selection) Display. After that file has been opened, Continue back to the main menu of IFs and click on the Display menu. From there, two display features have validation options.
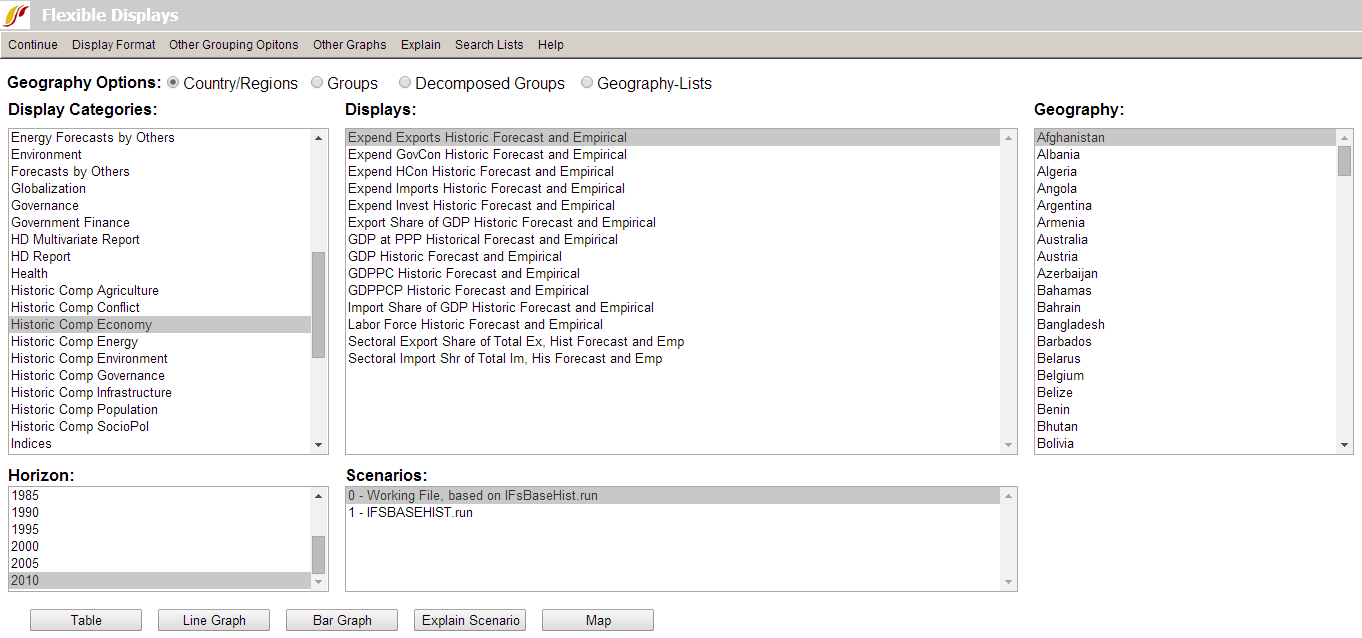
Users can open either Flexible Displays or Geographically-fixed Displays. In both of these display features, under the Display Categories box, the Historical Comparison option is available. Click on that (under Flexible Displays, more than one Historical Comp option becomes available), and a list of pre-packaged variables becomes available for display.
Below is a screenshot taken from Flexible Displays after IFsBaseHist has been opened. If you highlight the Historic Comp Economy category, for instance, all pre-packaged displays comparing historical forecasts and empirical data under Economy are shown in the Displays box in the middle: