 International Futures at the Pardee Center
International Futures Help System
Table Use
This help topic will go over possibilities available to users when they access a table while using IFs.
The format for tables used in IFs is displayed below:
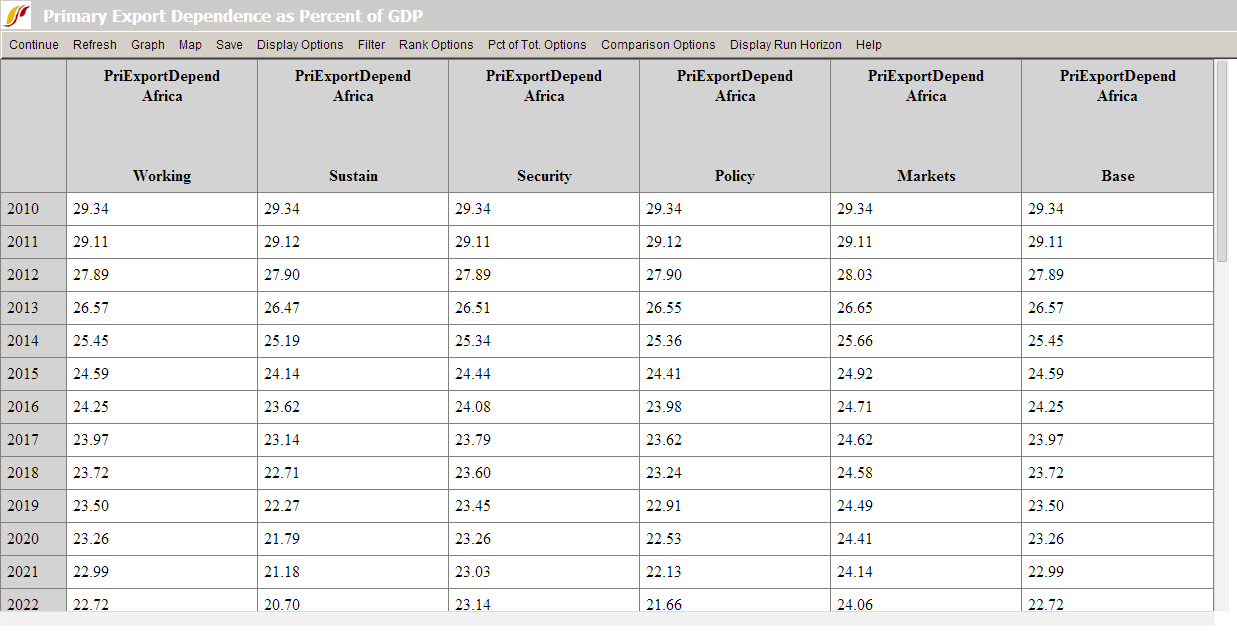
Users can access tables from many different forms within IFs. A typical table is organized into rows and columns with the rows representing different years and the columns representing different data and/or forecast series (depending on how the table is set up, the columns could also be one variable shown across different scenarios or geographic units).
Some users will want to save these tables to .xls files that can then be used for further analysis. IFs provides many save options and users will be interested in the transpose and decompose save features detailed below. Other users will be interested in highlighting values that are above or below a certain specified range. For example, users may want to look at GDP growth data that is higher than 5%. Scroll down this help topic to the Filter section to learn how to do this.
Continue: Use this option to go back to the previous menu or to the Main Menu of IFs.
Refresh: If you have made any changes away from the default settings of the table, clicking on Refresh will bring about the default table settings.
Graph: Click on this and you will be able to create a line or a bar graph.
Map: Clicking on this option will bring up the world map display.
Save: This option offers IFs users flexibility in saving their work.
- By selecting First Year to Save, you can determine at what year your saved file will begin.
- By selecting Save Normal View, you will be prompted with a screen that allows you to save your file in an Excel file with years as rows.
- By selecting Save Transpose, you are then able to decide whether you would like to save the table as all of the years, every 5 years or every 10 years. Transposing your data switches the columns and rows so that the years are across the columns of the table.
- By choosing Save Transpose and Decompose, users are able to save their data, move the years to the columns and automatically decompose geographic groupings into individual member countries. This is a very helpful feature of IFs for those who choose to display values for a group or G-list and who would then like that information broken down into individual members upon saving.
Display Options
- Percent/Whole: By toggling between these two sub-options, you can display data and/or forecasts regularly (whole) or as year-to-year percent change.
- Cumulative: You can choose to display your results regularly, or as a cumulative sum of values across time.
- Discount: This discounts all values past by base year by 3 percent each year; such discounting is often used in economic analysis.
- Cumulative with Discount: This sub-option combines discounting with accumulation over time (so as, for instance, to calculate the present value of a stream of expenditures or revenues).
-
Change Display Interval: This sub-option, at the bottom of the list, allows movement from display of all years to display of those at selected intervals (e.g. 5). (In the Flexible Display form the interval can also be changed before generating a table or graphic by using the select Set Title, Display Interval, or Year from the Display Format option on the forms menu). Unless the interval has been changed from every year, the following options will not be meaningful:
- Interval Average: This feature allows the user to toggle between regular displays and those that show the average value within a time interval when the numerical values are not shown every year. This feature somewhat smoothes the values so that the trends are more clearly shown. If the interval were set at 5, the value for the year 2015 would be calculated by adding the values for the years 2013-2017 and dividing that number by 5, and so on.
- Interval Total Change: This shows a percentage change from year to year across whatever interval the user selects (b/a*100).
- Interval Total Absolute Change: This shows an absolute change from year to year across the interval (b-a).
- Index Base One: This sub-option sets the initial year's value for each variable to 1 and displays the changes over time relative to that base value.
- Moving Average: This sub-option allows the user to smooth the data series or forecast over time. The average is "moving" because the recomputed values take into account values for previous and future years. Take the moving average for the population of the USA as an example, with the number of years included in the moving average set at 5. The value for the year 2012 with the moving average turned off is 317.9 million people (model version 7.0). With the moving average turned on, the value for the year 2012 becomes 318.9. The moving average for 2012 is calculated by adding the moving averages for the years 2010 and 2011, as well as the unaltered values for the years 2012-2014, and dividing the total number by 5. The moving averages for the years 2010 and 2011 are calculated similarly, although with fewer years due to the lack of years prior to 2010. The moving average for the year 2010 is calculated by adding the values for years 2010-2012 and dividing by 3. The user is able to change the number of years included in the moving average from the default number of years, which is 5.
- Unit Conversion: This sub-option changes units on the fly in tables, for instance energy units from billion barrels of oil equivalent to million metric tons of coal equivalent. The model recognizes some units (such as energy units) and offers a menu of choices. For other variables and units, the user will find no such menu, but may specify the units desired.
- Use Alias for Group Names: Most IFs group names are shortened for easy display, but aliases often exist and can be selected to improve display appearance.
Filter: This feature allows users to highlight certain variables that exceed or fall below user-defined thresholds.
- Set Filter Parameters allows users to customize what minimum, maximum, range and rate of change thresholds they would like IFs to highlight. For example, if you are displaying Youth Bulge information for all countries, set the minimum filter level at 0.5 to highlight country values above that level.
- Users are then able to click on either Apply Min Level Filter, Apply Max Level Filter, Apply Rate Level Filter or Apply Range Level Filter. After selecting what filter the user would like to highlight, IFs will change the font of those values identified by the filter bold. For our Youth Bulge example, click on Apply Min Level Filter and all country-year values with a youth bulge higher than 50% will be highlighted in bold.
Rank Options: This feature allows the user to set a year by which to rank the forecast in ascending or descending order across multiple countries or groups. For instance, a user can determine the country with the highest forecasted infant mortality rate in 2040.
Percent of Total Options: This feature scans across the columns of a table and computes the percentage that each column-year constitutes of the total across the columns for the year. It could be used, for instance, to show the percentage contribution of each energy type to the total energy production of the European Union.
Comparison Options: This feature allows the user to divide or subtract values in adjacent columns. While this feature is most likely to be used to compare forecasts of the same variable from two scenarios, it can be used for comparisons between different countries on the same variable, etc. The use of the feature requires the selection of an even number of columns.
Display Run Horizon: This allows users to choose how far into the future their table will forecast their selected variables.