 International Futures at the Pardee Center
International Futures Help System
Analyze Across Countries (Cross-Sectional Analysis)
From the Main Menu, an option under Data Analysis provides users with the ability to examine the relationship between historical variables. From the Data Analysis menu, select Analyze Across Countries (Cross-Sectional) to reach the screen displayed below.
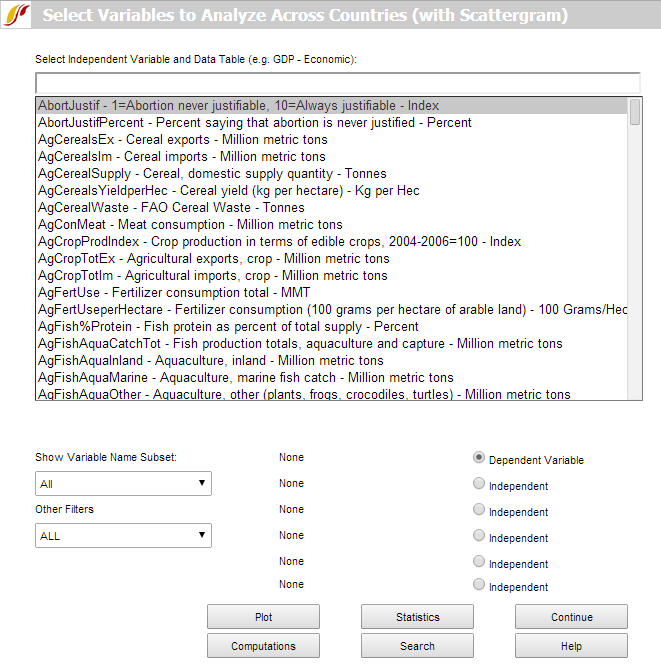
To do a cross-sectional analysis, specify a dependent variable (a variable you want to understand the causes of) and one or more independent variables (the possible causes of change in the dependent variable). By convention, the dependent variable appears on the y-axis and the independent variable appears on the x-axis on a graph. To select a dependent variable first, scroll through the alphabetized variable list and left-click on any variable in which a user might be interested. Click Select to choose that variable. Users can also type a variable name in the simple text search box directly above the list, which filters series by prefix. Alternatively, there is a more sophisticated search feature available through the Search button at the bottom of the screen. From the search screen, a search on "female", for example, would find all results that contain the word, anywhere in the variable name or description. After selecting a dependent variable, either from the variable list or from the search form, a drop-down list will appear, specifying the year to be displayed. A cross-sectional display includes data for a single year, earliest available or most recent available for each country. The process described here is also used to assign independent variables. To reassign any variable, select the corresponding option button and simply load the new series.
As a demonstration, plot a cross-sectional relationship between female education and reproduction rates. For the dependent variable choose total fertility rates, by selecting TFR from the list of variables. Left-click the variable and two options will appear: Select and Data Information. Click Select to choose that variable. The latter provides detailed information about the scope, availability and source of the data set. The ensuing drop-down list determines the year for which data will be displayed. For this example, choose 2010. Notice that TFR(2010) is then shown as the Dependent Variable. Next, choose an Independent Variable, the level of adult female education, by selecting EdYearsAge15Female for the same year. Click the Plot button to generate the graph displayed below.
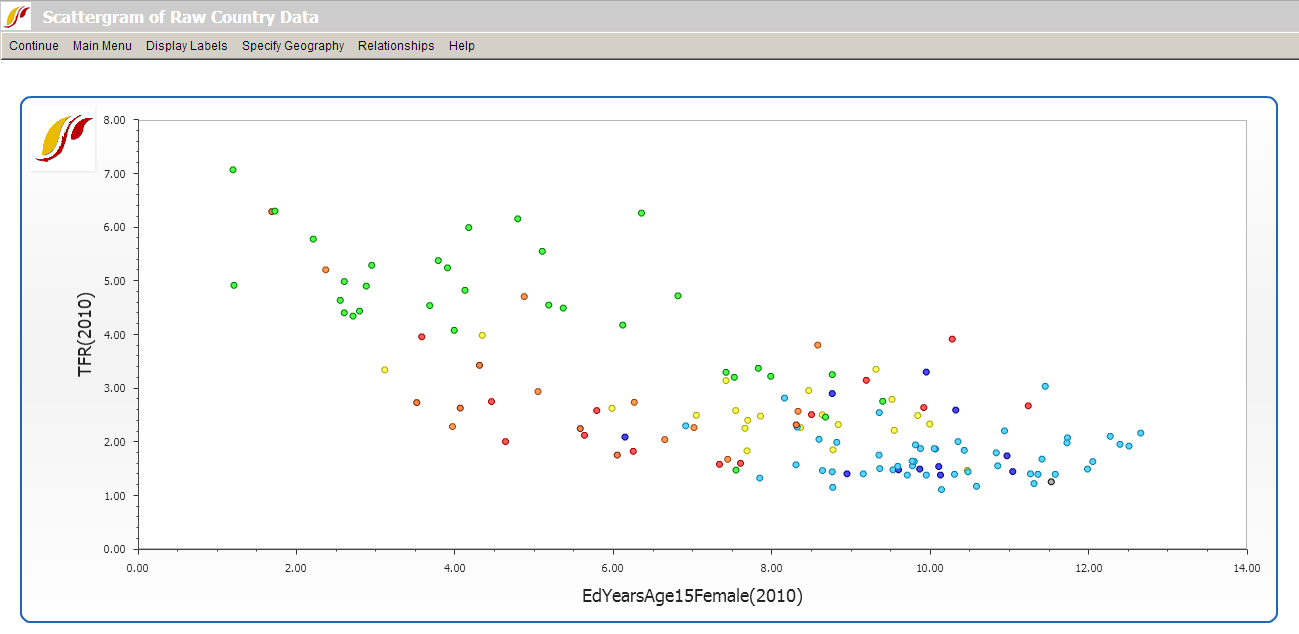
To learn how to use various features on the scatter plot, click here.