International Futures Help System
Performance and Risk Analysis
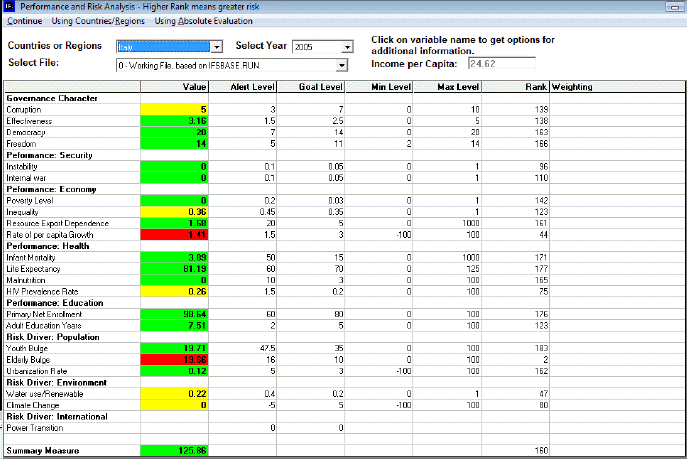
Performance and Risk Analysis is located under the Specialized Display sub-option, as well as on the Main Menu Map. This feature is a tool to forecast the level of risk and performance of a given country or group over a time horizon of nearly one hundred years.
The first step in using this feature is to decide whether to examine a country or a group. For this example, we shall use the country Venezuela.

Next, decide which year to examine. The year for the example above is set at 2010, but the user can view any year up to 2100. Next, decide which file to use. The example above is using the Policy First file.
The calculation of the performance and risk is based on a number of variables, such as Corruption, Youth Bulge, and State fragility, divided into categories, such as Governance, Population, and Social/Political. The variables are highlighted in green, yellow or red. The color indicates whether or not the variable has met the goal level set for that variable. If it has, the variable will be highlighted in green. If it has not, it will either be highlighted in yellow, if the value for the variable is between the alert level and the goal level, or in red, if the value for the variable has crossed the threshold for the alert level.
Notice that the example above has one variable highlighted in red. The value for corruption is 2.4216, which is below the alert level value of 3. Now, adjust the selected year to 2005. Instead of two variables highlighted in green and one in red, each of the values for the variables is highlighted in a different color. The value for the youth bulge is 0.4046, which is between the alert level value of 0.5 and the goal level of 0.4. The value of the variable is accordingly highlighted in yellow.
To look at a variable in greater detail, click on the variable. A box appears that allows the user to select from two options: either to show the variable over time, or to view the variable cross-sectionally. Choosing the first option will bring up a table with several columns, each representing the different run files the user can choose from. Choosing the second option brings up a graph, with the selected variable shown in relation with the GDPPCPPP for that country or group.
 International Futures at the Pardee Center