International Futures Help System
Poverty Level Display
This feature can be accessed from the main menu of IFs by clicking on Display, then Specialized Display and then Poverty Level Display.
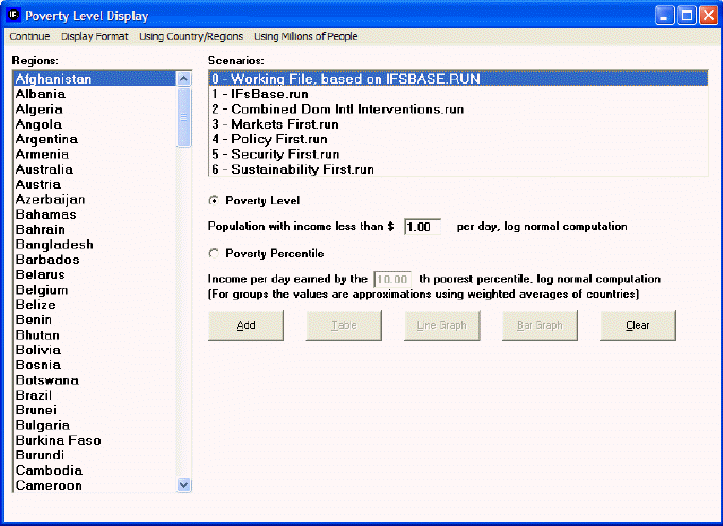
This display feature is useful for visually displaying forecasts of populations who live under a certain monetary constraint within a geographically bound region. For example, if you would like to see a forecast of people living in China who live under $1 a day, simply use the default settings of the "Population with income less than $ ___ per day, log normal computation," box, then select China from the Regions box and click the Add button to place it into the display box at the bottom of this display.
Then, choose to visually display this information as either a Table, a Line Graph or a Bar Graph.
It is also possible to change certain features of the display by selecting the Display Format button at the top of this menu. By selecting these options, it is possible to format your chart or graph for presentation and also change the time horizon of the display to fit your forecasting needs.
Next, it may be of interest to change the Using Countries/Regions and Using Groups toggle. This allows you to see a forecast of how many people live under certain monetary constraints in differently constructed geographically bound regions. The last toggle on this screen allows displays to be either in millions of people or in a percentage of population.

However, while $1 per day has been a gold standard for poverty measurement for many years, rising incomes have made it necessary to look at populations who live under a higher set of monetary constraints. For example, it is possible to change the default $1 setting to a higher setting, like $5 per day. Additionally, it is possible to display the nth poorest percentile in a country by selecting the Poverty Percentile button and then changing the percentage located in the box.
 International Futures at the Pardee Center