International Futures Help System
Analyze Across Countries (Cross-Sectional Analysis)
This option can be accessed from the Data Analysis option on IFs Main Menu.

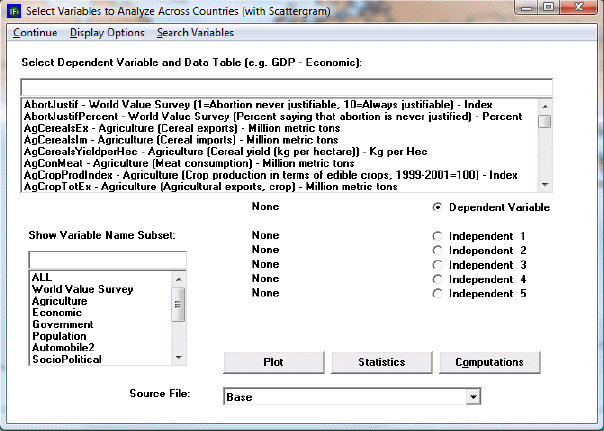
The menu of Analyze Across Countries is dominated by the Select Variable and Data Table. From this list, users are able to select from all of the data tables that underpin the functioning of IFs.
Note that the Select Variable and Data Table list box includes many variables that do not exist, or do not have the same names, in the IFs model. These are from the data base. When possible, data were gathered for many historic years, in order to provide the ability to analyze across time (longitudinal analysis, described later) as well as across countries at a given point in time (cross-sectional analysis). When you select a variable name for which data from more than one year is available, you will be asked to specify a year.
To do a cross-sectional analysis, specify a dependent variable (a variable you want to understand causes of) and one or more independent variables (the possible causes of change in the dependent variable). For instance, pick life expectancy (LifExp – SocioPolitical (Life expectancy at birth) - years) as the dependent variable. Many relationships in IFs treat Gross Domestic Product (GDP) per capita at purchasing power parity as an independent variable (GDP2000PCPPP – Economic (GDP per capita (PPP)) – 2000 PPP$). Click GDP2000PCPPP in the Select Variable list box. You will then have to choose a year. For this example, choose the year 2000. Notice that GDP2000PCPPP(2000) is then shown as the Independent 1 Variable. Click the Plot button to access the display of these variables.
An additional feature of the Cross-Sectional Analysis is the ability to look more closely at the data set in which a user might be interested. Left-click on any variable and a small window with two options will appear: Select and Data Information. Click Select to choose that variable. Click Data Information in order to access detailed information as to the scope, availability and properties of the data set in question.
At the bottom of the dialogue box is a drop-down menu with the title Source File. Choosing different source files allows the user to view and experiment with data for a small number of countries at the provincial level.
There are also Extended Features for Cross-Sectional Analysis.
 International Futures at the Pardee Center