 International Futures at the Pardee Center
International Futures Help System
Demographic Flow Charts
Overview
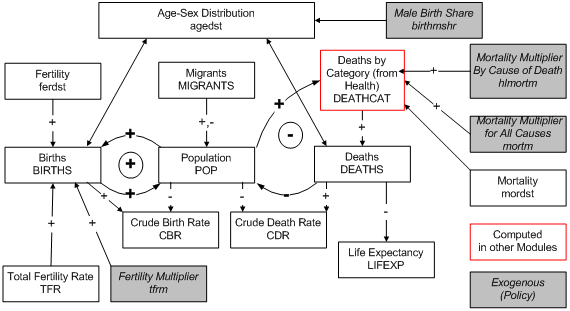
The demographic model represents the population of each geographic unit in terms of 22 cohorts (infants, five-year intervals up to age 99, and those aged 100 and older), separately for females and males. An age distribution records the population in each cohort and sex category. The sum across all cohorts in the age distribution and both sexes is the total population. A fertility distribution determines births, which are added to the bottom of the age distribution, while a mortality distribution determines deaths, which are subtracted from the appropriate cohort of the age distribution.
Those who might like to turn on the extension of age-cohort representation, to as many as 42, can do so by making changes in the IFsInit table of the IFsInit.mdb file. Specifically, the NCohorts field can be changed to as many cohorts as 42 and the NAges field can be changed up to 200. Registering these changes requires a rebuild of the Base Case (see documentation of Extended Features).
The population model is central to many broader dynamics of IFs. Two key feedback loops drive its own dynamics. The first is a positive feedback loop around fertility, linking population and births (causing population to drive exponentially upward if nothing else changes), while the second is a negative loop around mortality, linking population and deaths (causing population to decline). This second loop actually runs through the health model of IFs where deaths are computed (switching the control parameter hlmodelsw from 1 to 0 would, however, cause the model to revert to an earlier formulation in which life expectancy was computed as function of GDP per capita and controlled the death rate and deaths; it would turn off the health model's impact). A Malthusian variation of the negative feedback loop involving deaths may be of interest to those who believe that food supplies do or will play an important role in population dynamics (as they clearly do in countries with very low nutritional levels) by raising mortality rates, especially of children. See the topic on nutrition. Whether population rises or falls depends on the relative strength of those two loops.
The easiest and most often used scenario handles for the population model are a multiplier on the total fertility rate (the number of children borne by an average woman in a lifetime), namely tfrm , a multiplier on the total mortality rate, mortm , and a multiplier on mortality by cause, hlmortm .
A large number of indicators are calculated in IFs from the age distribution:
- the median age of the country's population (POPMEDAGE)
- population aged 15 to 65 (POP15TO65)
- population above age 65 (POPGT65)
- population below age 15 (POPLE15)
- population pre working age (POPPREWORK), controlled by the parameter specifying the work starting age ( workageentry )
- population post working age (POPRETIRED), controlled by the parameter specifying the retirement age ( workageretire )
- population within the working years (POPWORKING)
- the potential support ratio, or the population from 15 to 64 over that above 65 (POTSUPRAT)
- an indicator of the youth bulge or the population from 15 to 29 as a portion of that 15 and above (YTHBULGE)
In addition there are a number of indicators calculated from the size of country populations:
- the growth rate of population (POPR)
- the world population (WPOP)
- growth in the world population (WPOPR)
More description is available on the dynamics around fertility and mortality as well as several specialized topics on topics such as nutrition levels and migration. Please click on the links below to access these topics.