International Futures at the Pardee Center
International Futures Help System
Knowledge Systems Equations: Knowledge Sub-Indices
In this section we describe the calculation method for various IFs knowledge indices.
Human capital Index: KNHCINDEX
The purpose of this index is to capture the cross-country differences in the productive capacity of an average worker. We use two educational stock variables for the purpose. Differences in the rate of literacy, the sheer ability to read or write, make a big difference in productivity in more traditional type and/or informal activities. As the countries move gradually a more traditional agricultural economy to comparatively higher value added activities, e.g., assembling machineries or running a call center, secondary education become more important. The index is built through a combination of two sub-indices: literacy index, LitIndex and secondary attainment index, AdultSecPerIndex, weighted equally.
This index could be improved by adding a measure of the quality of education and an indicator of the skill-base of the worker. Unfortunately, IFs forecasts on those two areas are limited or non-existent at this point. [Note: The sub-indices – LitIndex and AdultSecPerIndex – used for this and other knowledge indices are calculated only in the model code. They are not available for display.]
![]()
Literacy index, with a theoretical range of values from 0 to 1, is calculated by dividing literacy rate, LIT, which can range from 0 to 100, by 100.
![]()
For the sub-index on secondary attainment (percentage of adults with completed secondary education), we use a similar normalization algorithm like the literacy sub-index.
![]()
LIT and EDSECPER are forecast in the IFs population and education modules.
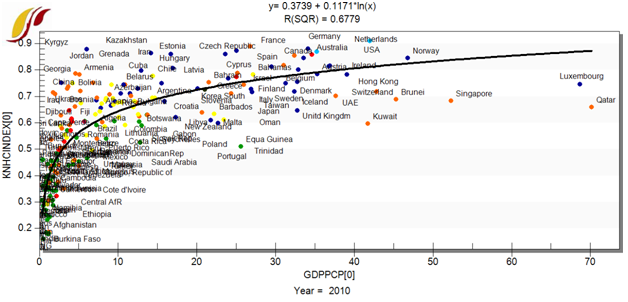
Because it excludes any measure of higher education which is included in the innovation sub-index (KNINNOVINDEX) described below, KNHCINDEX turns out to be very useful in showing the differences across developing countries. Even for richer countries, most of which achieved near universal secondary enrollment and universal literacy, the index shows significant variance coming from the secondary attainment differences among the elderly.
Innovation Index: KNINNOVINDEX
This IFs knowledge sub-index measures the innovation capacity of a nation through its R&D inputs – resources and personnel. It comprises of a total R&D expenditure index and a tertiary science and engineering graduation index as shown in the equations below.
![]()
For R&D expenditure, the highest spenders like Israel and Finland, spend close to or little over 4% of GDP and we use that number as a maximum to normalize all other countries in a zero to one range.
![]()
For science and engineering graduation rate, 25% is used as a maximum. The equations below show the calculation which uses tertiary graduation percentage, EDTERGRATE Total and the share of total graduates that obtain a science or engineering degree, EDTERGRSCIEN, both of which are forecast in the IFs education model.
![]()
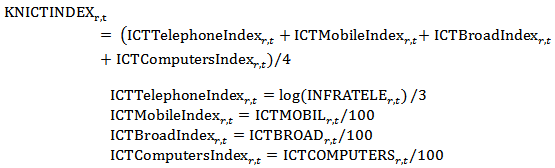
ICT Index: KNICTINDEX
Information and communication technologies (ICT) have a very significant role in facilitating the creation and diffusion of knowledge. IFs knowledge sub-index on ICT is built from the diffusion rates of core ICT technologies mobile, landline, broadband and a personal computer access rate sub-index. The telephone lines (fixed lines) sub-index, unlike the other three, use the logarithm of telephone line access rates as the differences in impacts of plain old telephone system decreases at higher access rates. In fact, the gradual shift from a wired to a wireless line as a personal communication device, demands that we reconsider the inclusion of this component in the ICT index.
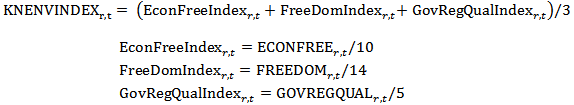
Governance and Regulatory Environment: KNENVINDEX
The existence of economic and regulatory institutions and an effective governance of such institutions are important for generation, diffusion and utilization of knowledge. IFs knowledge sub-index representing these, KNENVINDEX, is calculated from three sub-indices which are themselves indices forecast by other IFs modules. These indices, one for economic freedom, a second one for overall freedom in the society and a third one on governance regulatory quality are each normalized to a 0 to 1 scale and averaged to get KNENVINDEX.
For the variables economic freedom, political freedom and governance regulation quality and average them to KNENVINDEX.
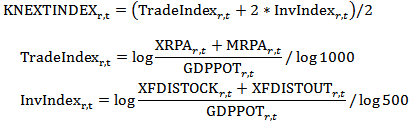
International Transfer Index: KNEXTINDEX
KNEXTINDEX attempts to represent cross-national knowledge flows, a major phenomenon in today’s globalized world. The more open a country is the more likely it is for her to learn from the global advancements in science, technology and other forms of knowledge. The sub-index that IFs calculates uses two indicators, trade and foreign direct investment (FDI). FDI indicator is given twice the weight given to trade volume.