 International Futures at the Pardee Center
International Futures Help System
Equations: HIV/AIDS
The ultimate objective of the calculations around HIV infections and AIDS is to forecast annual deaths from AIDS (AIDSDTHS) by age category and sex. We did not look to the forecast methodology of Mathers and Loncar (2006) for their approach on this particular communicable disease; in fact, they also used an approach that did not rely upon the general distal driver formulation.
The IFs approach begins by forecasting country-specific values for the HIV prevalence rate (HIVRATE). For the period from 1990-2007 we have reasonably good data and estimates from UNAIDS (2008) on prevalence rates and have used values from 2004 and 2006 to calculate an initial rate of increase (hivincr) in the prevalence rate across the population (which for most countries is now negative). [1]
There will be an ultimate peak to the epidemic in all countries, so we need to deal with multiple phases of changing prevalence: continued rise where rates are still growing steadily, slowing rise as rates peak, decline (accelerating) as rates pass the peak, and slowing rates of decline as prevalence approaches zero in the longer term. In general, we need to represent something of a bell-shaped pattern, but one with a long tail because prevalence will persist for the increasingly long lifetimes of those infected and if pockets of transmission linger in selected population sub-groups. [2] As a first level of user-control over the pattern, we add scenario specification via an exogenous multiplier on the prevalence rate ( hivm ).
The movement up to the peak involves annual compounding of the initial growth rate in prevalence ( hivincr ), dampened as a country approaches the peak year. Thus we can further control the growth pattern via specification of peak years ( hivpeakyr ) and prevalence rate in those peak years ( hivpeakr ), with an algorithmic logic that gradually dampens growth rate to the peak year: [3]
![]()
where
![]()
t is time, r is country or region. Names in bold are exogenously specified parameters.
As countries pass the peak, we posit that advances are being made against the epidemic, both in terms of social policy and technologies of control, at a speed that reduces the total prevalence rate a certain percent annually ( hivtadvr ). To do this, we apply to the prevalence rate an accumulation of the advances (or lack of them) in a technology/social control factor (HIVTECCNTL). In addition, if decline is already underway in the data for recent years, we add a term based on the initial rate of that decline ( hivincr ), in order to match the historical pattern; that initial rate of decline decays over time and shifts the dominance of the decline rate to the exogenously specified rate ( hivtadvr ). This algorithmic formulation generates the slowly accelerating decline and then slowing decline of a reverse S-shaped pattern with a long tail:
![]()
where
![]()
Finally, calculation of country and region-specific numbers of HIV prevalence is simply a matter of applying the rates to the size of the population number.
![]()
The rate of death to those with HIV would benefit from a complex model in itself, because it varies by the medical technology available, such as antiretroviral therapy (ART) and the age structure of prevalence. We have simplified such complexities because of data constraints, while maintaining basic representation of the various elements. Because the manifestation of AIDS and deaths from it both lag considerably behind the incidence of HIV, we link the death rate of AIDS (HIVAIDSR) to a 10-year moving average of the HIV prevalence (HIVRateMAvg). We also posit an exogenously specified technological advance factor ( aidsdrtadvr ) that gradually reduces the death rate of infected individuals (or inversely increases their life span), as ART is doing. And we allow the user to apply an exogenous multiplier ( aidsratem ) for further scenario analysis:
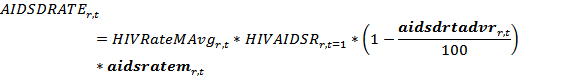
where
![]()
We spread this death rate across sex and age categories. We apply a user-changeable table function to determine the male portion as a function of GDP per capita (at PPP), estimating that the male portion rises to 0.9 with higher GDP per capita. [4] To specify the age structure of deaths, we examined data from large numbers of studies on infections by cohort in Brazil and Botswana (in a U.S. Census Bureau database) and extracted a rough cohort pattern ( aidsdeathsbyage ) from those data.
[1] The HIV/AIDS data were being update in October, 2013. The IFs pre-processor calculates initial rates of HIV prevalence and annual changes in it using the middle estimates of the UNAIDS 2008 data. When middle estimates do not exist, as in the case of the Democratic Republic of Congo, it uses an average of high and low estimates. The system uses data for total population prevalence, but also includes HIV prevalence for those 15-49.
[2] A more satisfactory approach would use stocks and flows and have a more strongly systems dynamics’ character. It would track infected individuals, presumably by age cohorts, but at least in the aggregate. It would compute new infections (incidence) annually, adding those to existing prevalence numbers, transitioning those already infected into some combination of those manifesting AIDS, those dying, and those advancing in age with HIV. But the data do not seem widely available to parameterize such transition rates, especially at the age-category level.
[3] Table 17 (pp 77-78) of the Annex to World Population Prospects: the 2002 Revision (UNPD 2003) provided such estimates for 38 African countries and selected others outside of Africa; the IFs project has revised and calibrated many of the estimates over time as more data have become available. By 2004-2006, however, quite a number of countries had begun to experience reductions, and this logic has become less important except in scenario analysis for countries where prevalence is still rising.
[4] Early epidemic data from sub-Saharan Africa and the United States supported this assumption.