 International Futures at the Pardee Center
International Futures Help System
Equations: Attainment
There are two types of variables that keep track of educational attainment: average years of education of adults (EDYRSAG15, EDYRSAG15TO24 and EDYRSAG25) and percentage of adults with a certain level of education (EDPRIPER, EDSECPER, EDTERPER). Both groups forecast attainment by gender.
The basis of calculation for both groups of variables is educational attainment by age cohort and gender as contained in intermediate model variables, EDPriPopPer r.g,c,t , EDSecPopPer r.g,c,t, EdTerPopPer r.g,c,t (where, r stands for country or region, g for gender, c for cohort and t for time).
We initialize attainments of the entire adult population (EDPRIPER, EDSECPER, EDTERPER) using historical data estimated by Barro and Lee (2000) and use a spread algorithm. The spread algorithm starts with the most recent data on school completion rate (EDPRICR for primary) which is considered as the average attainment of the graduating cohort. The algorithm then uses the differential between that completion rate and the attainment rate of the adults (EDPRIPER) to back calculates a delta reduction for each of the older cohorts (EdPriPopPer) such that averaging attainments over cohorts one can obtain average attainment for all adults (EDPRIPER).
![]()
where, subscript c stand for five year age cohorts going from 1 to 21. Cohort 4, represents the 15 to 19 years and NC, total number of age cohorts.
For subsequent forecast years, cohort educational attainment for each level of education is calculated by adding graduates from that level of education to the appropriate age cohort, advancing graduates from the younger cohort, and passing graduates to the older cohort.
![]()
where, pc stands for the five year age cohort where the primary graduates belong. For all other cohorts:
![]()
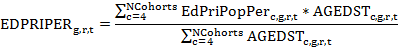
Cohort attainments for secondary and tertiary education (EDSECPOPPER, EDTERPOPPER) are initialized and forecast in a similar fashion. An average years of education reflecting completion of levels is then calculated by from the cohort attainment, population and cohort length as shown in the next equation where AGEDSTc,g,r,t contains the population of five year age cohorts and EDPRILEN r,t is the duration of primary cycle in years.

For those who dropout before completing a certain level we need to calculate the partial attainment and add that to the average years of education. The average of the partial years of education at a particular year is calculated from dropouts by level and grade as shown below. Calculation of the average of partial years resulting from dropouts in primary education is illustrated in the equations below. Partial years from current year dropouts at other levels of education are calculated in the same manner and all the partial years are averaged to an overall average. This new partial attainment is then added to the partial attainment of five year cohorts which are initialized and advanced in a similar manner as that used for cohort averages on completed attainment.
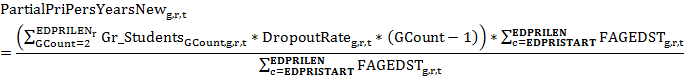
Here, EDPRISUR is the survival rate in primary education, EDPRISTART is the official entrance age for primary schooling, Gr_Students is the enrollment at a certain grade, GCount is the grade counter and FAGEDST is the population of the single year age cohort corresponding to the grade level.
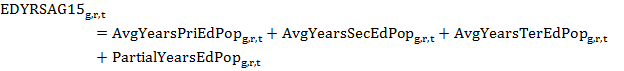
Overall attainment, i.e., average years of education are calculated by averaging the attainments and partial attainments of five year age cohorts as shown in the equation below. The suffixes on the variables EDYRSAG15, EDYRSAG15TO24 and EDYRSAG25 indicate the age thresholds at which or the age bracket over which attainment is averaged.
Attainments by level, i.e., EDPRIPER, EDSECPER and EDTERPER are also obtained by summing across the corresponding five year cohorts, i.e., EdPriPopPer etc.
Cohort attainments by level of education are also used in to build a specialized educational attainment display, commonly referred to as education pyramid in congruence with demographic pyramids used to display population by age cohorts stacked one on top of the other with the men and women cohorts put opposite to each other around a vertical axis. Education pyramid superimposes educational attainment on top of the demographic pyramid.