International Futures Help System
Socio-political Equations: Life Conditions
Literacy changes from the initial level for the region because of a multiplier (LITM).
![]()
The function upon which the literacy multiplier is based represents the cross#sectional rela"tionship globally between educational expenditures per capita (EDEX) from the government submodel and literacy rate (LIT). Rather than imposing the typical literacy rate on a region (and thereby being inconsistent with initial empirical values), the literacy multiplier is the ratio of typical literacy at current expenditure levels to the normal literacy level at initial expenditure levels. This formulation predates the development of an educational module that calculates the numbers of those with a primary education (one common definition of literacy). As that module is refined, we will likely derive literacy dynamics from it.
![]()
Educational expenditures (and thus implicitly literacy and labor efficiency) are tied back to the economic model via the economic production function.
Given life expectancy, literacy, and infant mortality levels from the mortality distribution, it is possible to compute the Physical Quality of Life Index (PQLI) that the Overseas Development Council developed (ODC, 1977: 147#154). This measure averages the three quality of life indicators, first normalizing each indicator so that it ranges from zero to 100. The normaliza"tion is not needed for literacy; for life expectancy it converts the range of approximately 28 (LIFEXPMIN) to 80 (LIFEXPMAX) years into 0 to 100; for infant mortality it converts the range of approximately 229 per thousand (INFMORMAX) to 9 per thousand (INFMORMIN) into 0 to 100.

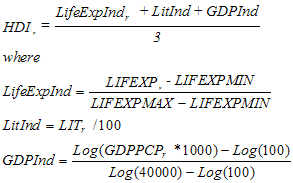
For most users, the United Nations Development Program’s human development index (HDI) has replaced the PQLI as an integrated measure of life condition. It is a simple average of three sub-indices for life expectancy, education, and GDP per capita (using purchasing power parity). The life expectancy sub-index is the same as was used for the PQLI. The literacy sub-index is again the literacy rate. The GDP per capita index is a logged form that runs from a minimum of 100 to a maximum of $40,000 per capita. The measure in IFs differs slightly from the HDI version, because it does not put educational enrollment rates into a broader educational index with literacy; that will be changed as the educational model of IFs is better tested.

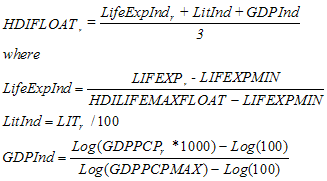
Although the HDI is a wonderful measure for looking at past and current life conditions, it has some limitations when looking at the longer-term future. Specifically, the fixed upper limits for life expectancy and GDP per capita are likely to be exceeded by many countries before the end of the 21st century. IFs has therefore introduced a floating version of the HDI, in which the maximums for those two index components are calculated from the maximum performance of any state in the system in each forecast year.

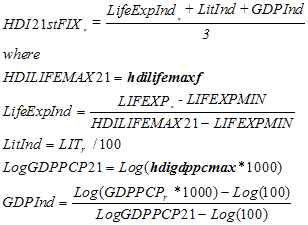
The floating measure, in turn, has some limitations because it introduces relative attainment into the equation rather than absolute attainment. IFs therefore uses still a third version of the HDI, one that allows the users to specify probable upper limits for life expectancy and GDPPC in the twenty-first century. Those enter into a fixed calculation of which the normal HDI could be considered a special case.

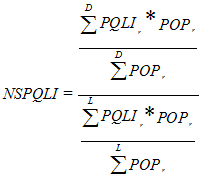
It is useful to compute several additional global indicators, a world physical quality of life index (WPQLI), a world life expectancy (WLIFE), a world literacy rate (WLIT), and a North#South gap index or ratio of quality of life in the "developed -D" regions to the "less developed-L" regions (NSPQLI).


 International Futures at the Pardee Center