 International Futures at the Pardee Center
International Futures Help System
Productivity
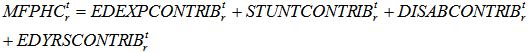
Health outcomes impact productivity through a variety of pathways (see Figure 8.3). Overall the function for multifactor productivity from human capital (MFPHC) is a sum of a term linked to educational expenditures (EDEXPCONTRIB) and three terms of interest to us here because mortality and morbidity affect them. Those three of interest are adult stunting (STUNTCONTRIB), disability (DISABCONTRIB) and years of education (EDYRSCONTRIB). We detail these three contributions in turn.
Stunting Contribution
In the IFs health module, the prevalence of adult stunting (HLSTUNT) relates negatively to overall productivity (an elasticity of -0.025, in mfpstunt). In extreme cases, stunting could cost as much as 1 percent of economic growth.
![]()
where
![]()
We compute HLSTUNT in the health model itself. We initialize adult stunting in a long-term lagged relationship (using a moving average of 25 years) [1] with child malnutrition and forecast it as a function of both malnutrition and child mortality as a proxy for morbidity. Initial values in 2005 range up to about 55 percent for India and Bangladesh and even over 80 percent for Somalia; in the base case these generally but not universally decrease. [2]
To initialize HLSTUNT in the preprocessor, IFs must first estimate historic levels of childhood undernutrition (MALNCHP): [3]
![]()
First we find the result of this function with GDPPCP numbers from 2005, then we compute an additive shift factor to match initialization data for MALNCHP(2005). Second we compute the result of the function with GDPPCP from 1980 and apply the shift factor to estimate HLSTUNT in 2005. We use a limit of 80% for the maximum possible stunting value.
IFs forecasts HLSTUNT using an extremely slowly moving average:
![]()
Childhood malnutrition and morbidity do not give rise to all disability in working years; much also comes from disabilities arising during the working years. IFs therefore also calculates millions of years of living with disability related to mortality rates specific to the working aged-population. [4]
Disability Contribution
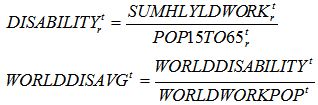
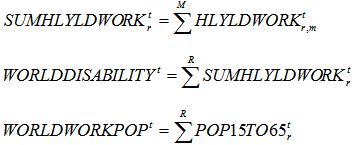
Turning to the forecasting relationship between disability and productivity, the IFs approach drives changes in the growth of productivity from the changing difference between computed and expected values of disability. [5] Because we have replicated the practice of the GBD project and kept mental health disability rates constant over time, and because mental health generally dominates disability, forecasts of this disability term are relatively stable over time. Thus analysis with respect to this variable will depend on scenarios that increase or decrease those disability rates. In IFs, changes in disability levels result in a -0.5 change in productivity (mfphlyld = 0.5 in the Base Case).
![]()
where
where
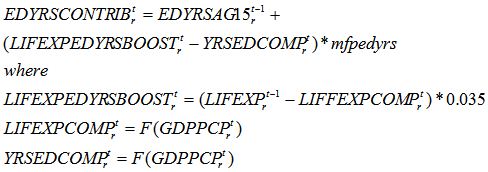
Education Years Contribution
Soares (2006: 72) found in cross-sectional analysis that 10 years of additional life expectancy add 0.7 years to the average years of education attained. Ashraf, Lester, and Weil (2008: 10) built on other work on seven sub-Saharan African countries to conclude that 20 years of additional life expectancy add 0.386 average years of education. We used this analysis to support our relationship between life expectancy (as a proxy for morbidity including that of children) to productivity via increased education. IFs associates each year of incremental life expectancy with a value of 0.035 years of education for those 15 years of age and older (thus, in essence using education years as a proxy for quality as well as quantity of educational attainment).
[1] The lag is the difference from the midpoint of childhood (7.5) to the midpoint of adulthood (32.5).
[2] Global data on stunting among adults appear nearly nonexistent. UNICEF (2009:5) suggests that under-5 stunting exceeds that of malnutrition (200 versus 130 million) and that stunting is nearly irreversible with aging; these facts suggest very high percentages of stunting among global adults, concentrated in Africa and Asia.
[3] While IFs includes historic data series from WDI and WHO for child undernutrition, many countries do not have data for 1980 (25 years prior to 2005, our initial year).
[4] As a quick reality check on those numbers, dividing disability years for the working population by population aged 15-65 generates numbers in 2005 that range from around 0.20-0.27 at the top end of the range (Timor-Leste, Afghanistan, Montenegro, Puerto Rico, Cambodia, and mostly other African countries) to 0.05-0.06 at the bottom end (Kuwait, UAE, Cape Verde, Algeria, Japan and mostly other rich countries).
[5] Because mental health rates do not change in base forecasts, we used the world average as an “expected” value—in 2005 that value, with mental health included, is .097 (mental health alone accounts for .025). That is, we calculate about 0.1 year of disability per worker across a working life.