 International Futures at the Pardee Center
International Futures Help System
Maintaining Increase with Age in Non-Communicable Death Rates
In general, both in our initial conditions and forecasts, we try to maintain monotonicity in growth of death rates from chronic causes with increasing age (above 45) by adjusting deaths from a particular cause when initial computations do not illustrate increases with age and compensating in death rates from an alternative cause for which initial computations indicate room for mortality reduction while (a) maintaining monotonicity for that cause also and (b) not changing total mortality in the pair of causes. [1] If necessary we also work to make acceptable adjustments in one age category by readjusting the next age category for the same cause of death, decreasing deaths in the younger age category and increasing deaths in the older one, while doing the opposite for the compensating cause of death. Finally, in this overall and quite complicated algorithmic process we try to minimize the adjustments made to the initial calculations of mortality.
To elaborate this process further, when we find for a chronic cause of death a monotonicity problem for a country and a given age category relative to the next younger category, we find the type (H1) with the highest mortality rate (in the 100+ category among non communicable disease), [2] then we try to use H1, which often turns out to be cardiovascular disease, to compensate adjustments in other types in order to keep total mortality constant for the same age category.
For each 5-year age category starting at 45 to 49, we compute total mortality as the sum of all types, then for each non-communicable type with non-zero mortality we compute its growth G from the current age category j to the next j+1, for example in the first step from 45-49 to 50-54. Although our emphasis is on avoiding non-monotonicity, we also would like to see some regularity of progression of mortality increase with age, as we find in the quite high-quality data of Sweden. Thus we also look to that progression in Swedish data for a rate of increase of across age categories that we can use as a minimum. Specifically, across two adjacent age categories we find a Proxy growth P, where we use Sweden’s mortality for each type, but we do not allow this P to be higher than 1/4th of Total Mortality Growth. If G is smaller than P then we start the procedure for the given age category j and type of mortality d.
[3]
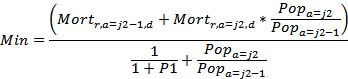
Once we start the adjustment procedure we check if there is room to reduce mortality in the current age and type, so we check growth from the previous age category to avoid breaking monotonicity. First we compute Proxy Growth P1 from the previous age category j-1 (40-44 for our example) to the current one j (45-49).
Second we compute the minimum acceptable value for current mortality:
![]()
where ![]() is the mortality for country r, type d in age category j-1.
is the mortality for country r, type d in age category j-1.
Third we compute maximum acceptable value for current mortality, we start with:
![]()
But we know that ![]() is also going to change to keep the number of deaths constant, so we also consider this adjustment:
is also going to change to keep the number of deaths constant, so we also consider this adjustment:
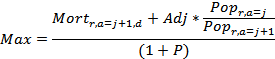
And we know that:
![]()
Solving for max, we have:
Where Mort is the original mortality for age category j and j+1, country r, and type d. Pop is population for age j and country r and P is the Proxy Growth computed as explained above.
If Min is smaller than Max, then we use Max as the new mortality in age j, in order to keep the adjustment as small as possible, if not that means that Max wouldn’t keep monotonicity from age j-1, so we start trying to adjust going backwards, given that frequently there’s more room in previous age categories. In order to start going backwards we keep track of the first age category that it’s already saturated, i.e. that its growth is already the minimum possible without breaking monotonicity. If we find that the first saturated category is higher than the 45-49 that we started with, that means we have some room going backwards, so we take Max, otherwise we use Min as the new mortality in age j, and keep adjusting forward. The adjustment A is just the difference between original mortality in age j and the new chosen mortality.
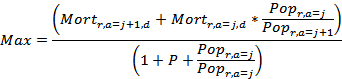
Adjust backwards means that we will adjust mortality in age category j2 and j2-1, where j2 goes from j-1 to 10 (which corresponds to 45-49). While going backwards the formulas for min and max change a little bit, given that the adjustment is done in the previous age category.
![]()
And substituting the adjustment computed earlier (![]() ),
),
we end up with:
Max gets simplified to:
![]()
We then check for room in type H1, and if there’s enough room we adjust mortality for j2. If Min <= Max then we can stop, otherwise we keep going back until we reach the 45-49 category.
Fourth, we verify that, in doing compensation for type H, monotonicity is preserved too. In order to make this verification first we find the potential growth rate GH after applying adjustment A to type H. Then we compute the Proxy Growth PH for type H. If GH is greater or equal than PH then we can apply the adjustments if not we just leave mortality unchanged.
Fifth, applying the adjustments to type d by subtracting the adjustment from the original mortality in age j for type d, and adding it up adjusted for deaths to the original mortality in age j+1 for type d:
![]()
![]()
Sixth, applying the adjustments to type H by adding the adjustment to original mortality in age j for type H, and subtracting it adjusted for deaths from the original mortality in age j+1 for type H:
![]()
![]()
Seventh, if Min is greater than Max and we couldn’t go backwards means that we took Min as the new mortality for age k, and it means that we still don’t have monotonicity because we haven’t changed age j+1 yet. Then we need to find the new mortality value for j+1 using Proxy Growth:
![]()
![]()
Eighth, we check that this new adjustment doesn’t break monotonicity in death type H, if it doesn’t we apply it as we did for age j, if does break it, we just leave mortality unchanged.
Ninth, applying this adjustment is the same as step 5 and 6, but using ages j+1 and j+2 instead of j and j+1. The only difference here is that when we get to the second to last age category (j = 20, 95-99), [4] then the compensatory adjustment for deaths is done in the first age category of the loop (j=10, 45 to 49), and we restart the process for a second and final check of monotonicity.
We have added check limits along the process to avoid mortality going above 1000 per 1000 and below 0 per 1000 at all times, and if the limits are reached then mortality is left unchanged.
[1] The changes described here for monotonicity with age do not guarantee monotonicity of changes in rates over time within an age category. In fact, they could contribute to some small transients or irregularities in rates over time. In general, however, we believe that they will make such behavior less likely. For such irregularities, see the longitudinal curve in Afghanistan for cancer at 80-84 males; these are most likely to appear, as they would in the real world, when total mortality is not changing much over time.
[2] In specialized work looking at low senescent aging the last category is 200+.
[3] An example can illustrate. Say male mortality is 0.5 for Cancer at 45-49, and 1.1 for 50-54, then P is 140% (these are numbers from Sweden). Say total male mortality is 10.1 for 45-49 and 14.5 for 50-54, so total growth is 43%. (These are numbers for any country, say Afghanistan). We can’t use P of 140% on Afghanistan for male cancer, given that for those ages Total Mortality grows only 43%, so we use a Proxy (P) of 11% (43*.25), for male cancer in Afghanistan between ages 45-49 and 50-59. G is the actual growth in mortality for male cancer in Afghanistan between ages of 45-49 and 50-54; say for example: 0.7664, 1.2876 respectively, so G is 68%. In this example, there is no need to change anything (68 > 11). Only if G is smaller than P does the adjustment process begin.
[4] In specialized work looking at low senescent aging the last category is 195-199.