 International Futures at the Pardee Center
International Futures Help System
Performance Risk Analysis Form
IFs includes a Performance Risk Index (GOVRISK) and an associated display to facilitate Performance and Risk Analysis, for instance by changing the weight of variables in the index. The design is intended primarily for analysis of single countries, but the form allows also consideration of country groups. It also facilitates comparison of alternative scenarios, mainly to display single country characteristics, but with the ability to switch to groups, compare different scenarios, different countries or groups.
The overall risk form and index build on nine categories of variables:
The first three categories correspond to the three dimensions of governance in IFs but do not use precisely the same sub-dimensional variables (in part because the performance risk index is itself a sub-dimension of security and that would create a circularity, but partly also because the risk index is meant to be a dynamic assessment vehicle that allows users to tailor the analysis to their own understanding of what constitutes risk. The three governance dimensions and variables used in the index are: security (instability and internal war); capacity (corruption and effectiveness); and inclusion (democracy, freedom, and the gender empowerment measure).
The next three categories in the index are associated with drivers that many analysts have associated with country risk. The categories and associated variables are: population (youth bulge, elderly bulge [with a 0-weighting for the developing country oriented analysis of interest to most form users], and urbanization rate); environment (water use as a portion of renewable supplies and climate change); international (power transition).
The final three categories in the index represent specific arenas of government and societal performance. Again with associated variables they are: the economy (poverty, inequality, resource export dependence, and per capita GDP growth rate); health (infant mortality, life expectancy, malnutrition and HIV prevalence); and education (primary net enrollment and years of formal education of adults).
Information about each country across variables is organized into two clusters of columns. The first cluster provides information about values and ranks:
The Value column is the actual IFs forecast for each specific variable (for instance, the life expectancy for Angola in 2010 reflects data and is near 50.
The Min Level and Max Level columns indicate the overall range over which each variable varies across counties and time. These levels are constant across years and countries. They are used in computing the Scaled Levels.
The Scaled Level column uses the minimum and maximum levels to scale values for each country from 0 to 1. The scaling takes into account the valence of each variable (that is, infant mortality is bad and life expectancy is good). The Summary Measure in the last row of this column is a weighted average of the scaled levels on each variable; this computation is saved as the GOVRISK variable in our forecast files for each country and each year
The Global Rank column indicates how each country ranks among all countries on each variable. The Summary Measure in the last row at the bottom of the column uses a weighted average of the ranks for each variable to compute the ordinal position of the country when sorting across all countries. Lower Ranks indicate higher risk levels (or worst performance). Clicking on any cell in this column provides a pop-up option for showing the rank of all countries on specific variables or the Summary Measure.
The Weighting column determines how the variables are combined in computing the summary Scaled Levels and Global Ranks of a country. Clicking on any cell in that column allows the user to change the weight for the associated variable.
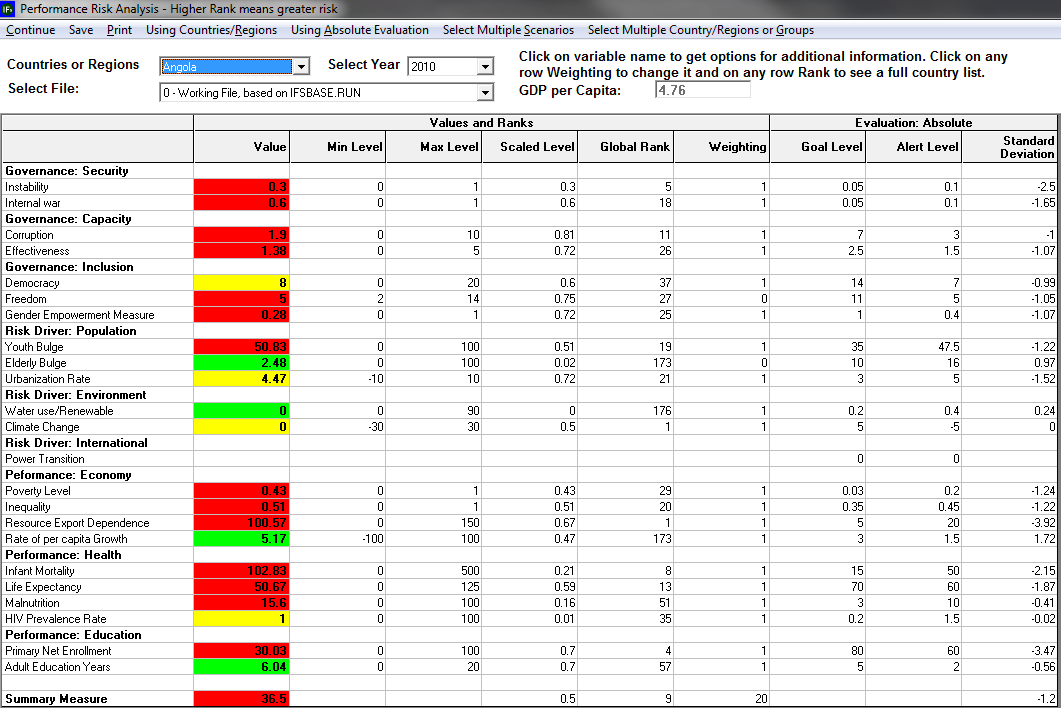
The color for each variable in the Value column indicates the position of the value relative to the alert and goal levels. Values between the alert and goal levels are yellow, values on undesirable side of the alert level (depending on the valence of the variable) are red, and values on the desirable side of the goal level are green. For the Summary Measure the color coding is a bit different: .red indicates the 40 countries performing least well in the aggregate (numbers 1 through 40 in the Global Rank column), green shows the 40 countries doing best; yellow indicates all other countries.
The second cluster of columns provides evaluation information. Evaluation can be either absolute or relative to income (actually GDP per capita), as determined by the menu option that toggles between those two forms (the column cluster heading changes also with the toggle value). The default approach is absolute evaluation, setting up comparison of countries and evaluation of their performance independently of their development level.
The relative or income-adjusted evaluation approach takes into account the GDP per capita of the country and has a "benchmarking" character. That is, evaluation of countries takes into account the GDP per capita at PPP of countries, expecting different performance at difference levels. The expectations upon which relative evaluation occurs are related to cross-sectionally estimated relationships of the Values for each variable across all countries. For instance, the cross-sectional relationship for Inequality using the Gini index (on the Y-axis) as a function of GDP per capita at PPP (on the X-axis) is the following:
Higher values indicate poorer performance or more risk and Colombia is shown on this figure as having a considerably higher than expected level of inequality. We would expect Colombia to be evaluated poorly on this variable both in absolute terms and relative to its income level.
The columns in the Evaluation cluster are:
Goal and Alert Levels will change depending on the evaluation method. When using absolute evaluation, the level values will not vary across countries (we have set absolute Goal and Alert Levels exogenously based on our own analysis across countries). When using income-adjusted or relative evaluation, the values will be recomputed based on the GDP per capita level of a specific country in a given year. Specifically, in income-adjusted evaluation the Goal Levels are generally set at the value of the function for the GDP per capita of the country in the year being analyzed. The Alert Levels are generally 1 or 2 standard errors below or above the value of the function;[1] below or above depends on whether higher or lower values indicate better performance.
The third evaluation column will show the Standard Deviation of Values for all countries around the global mean in the case of Absolute Evaluation and will show the Standard Error of all countries around the function in the case of income-adjusted evaluation.
Useful information can be obtained beyond that apparent in the table by clicking on particular cells:
Cells within the Value, Scaled Level, and Standard Deviation/Standard Error columns can be displayed across time by clicking on them and selecting the pop-up menu option.
You can generate a rank-ordered list of countries based on a given variable by clicking on a cell in the Global Rank column and selecting the pop-up menu option.
Clicking on a cell in the Value column and selecting the option "Display All Years and All Countries Ranked" produces a table of all values for all countries across time with countries ranked left-to-right from riskier to less risky values in the selected year.
Clicking on any variable name provides a pop-up menu with useful information related to evaluation. The Cross-Sectional Relationship option on that pop-up shows the function for the variable and selected country's position relative to the function. The Provide Information option provides information on the Goal and Alert Levels for any specific variable; it also gives a set of information explaining the variable and bibliographic references when available. The Show Count option will display the number of countries in alert level, moderate risk or not at risk using absolute evaluation only.
Additional menu options exist on the form:
On the form called up by Select Multiple Scenarios holding down the Ctrl key allows selecting multiple scenarios. Once selected they can be displayed simultaneously, for instance by clicking on a cell in the Value column and selecting the pop-up option to Show Over Time.
On the form called up by Select Multiple Country/Regions or Groups holding down the Ctrl key allows selecting multiple countries or groups; again these can be displayed, for instance, by clicking on a cell in the Value column and requesting Show Over Time.
Using Countries/Regions is the default menu option geographically, but it toggles with click to Using Groups. Groups are displayed with ranks that weight country members by population (the group aggregations of Values use varying weighting variables; for instance, the climate change variable uses GDP).
[1] There is subjectivity in this. We mostly use 2 standard errors (11 times); next we use 1 SE (9 times: Elderly Bulge, Poverty Level, Inequality, Rate of per capita Growth, Infant Mortality, Life Expectancy, Malnutrition, Adult Education Years and Urbanization Rate); then use 0.5 twice: Democracy and Freedom,' and finally we use 0.2 for GEM.