 International Futures at the Pardee Center
International Futures Help System
Equations: Budget Flow
Resources required to maintain the projected student flows are determined by multiplying enrollment rates with per student cost forecasts. Availability of resources, as determined in the IFs socio-political model, affect flow rates and the final enrollment rate.
Public expenditure per student (EDEXPERPRI) as a percentage of per capita income is first estimated (CalExpPerStud) using a regression equation. Country situations are added as a shift factor (EdExPerPriShift) that wears off over a period of time (edexppconv) in the same manner as those for student flow rates. The following group of equations show the calculation of per student expenditure in primary (EDEXPERPRI).

Total fund demand (EDBUDDEM, see calculation below) is passed to the IFs socio-political model where a detail government budget model distributes total government consumption among various public expenditure sectors. For education allocation, an initial estimate (gkcomp) is first made from a regression function of educational spending as a percentage of GDP over GDP per capita at PPP dollars (GDPPCP) as a country gets richer.
![]()
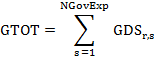
Like several other functions discussed in this sub-module, country situation is reflected by estimating country ratio (gkri) between the predicted and historical value in the base year. This ratio converges to a value of one very slowly essentially maintaining the historic ratio. Public spending on education in billion dollars (GDS) is then calculated using the regression result, GDP and the multiplicative shift.
Sociopolitical model also forecast public spending in other areas of social spending, i.e., military, health, R&D. Another public spending sector, infrastructure is calculated bottom-up, i.e., as an aggregation of demand for construction and maintenance of various types of infrastructure.
Once all the spending shares are projected, a normalization algorithm is used to distribute the total available government consumption budget (GOVCON) among all sectors.
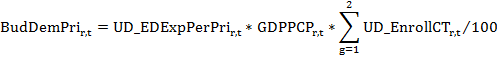
Before normalization, a priority parameter allows setting aside all or part of fund demands for the ground up spending sectors, i.e., infrastructure and education. For education sector, the prioritization parameter (edbudgon) is used to set aside a certain portion of the projected education investment as shown in the equations below.
Education allocation, GDS (Educ) calculated thus is taken back to the education model. A second normalization and prioritization is done within the education model to distribute total education allocation among different levels of education. This across level normalization uses the percentage share of each educational level in the total demand for education funding. First, total expenditure demand for all levels of education combined is determined by multiplying the total enrollments with per student costs. The following equation shows the calculation for Primary.
Fund demands for all levels are added up to get the total fund demand under no budget constraint. The prefixes UD here stands for budget unconstrained demand.
![]()
Any surplus or deficit in educational allocation, calculated as the difference between education sector allocation in the government budget model and the total fund requirement for all levels of education combined, first undergoes an adjustment algorithm that boosts (in case of surplus) or reduces (in case of deficit) per student cost for those countries which are below or above the level they are supposed to be. Post this adjustment, allocation is distributed across all levels using a normalization process based on demand.
A budget impact ratio is then calculated as the ratio of the fund demanded (CalcTotCost) and fund obtained (CalcTotSpend). This budget impact ratio (CalcBudgetImpact) increases or decreases the pre-budget (or demand side as we call it) projection of student flow rates (intake, survival, and transition). The positive (upward) side of the budget impact is non-linear with the maximum boost to growth occurring when a flow rate is at or near its mid-point or within the range of the inflection points of an assumed S-shaped path, to be precise. Impact of deficit is more or less linear except at impact ratios close to 1, whence the downward impact is dampened. Final student flow rates are used to calculate final enrollment numbers using population forecasts for relevant age cohorts. Finally, cost per students are adjusted to reflect final enrollments and fund availability.
Budget impacts uses a non-linear algorithm intended to generate an S-shaped growth rate. Final enrollment is then calculated from this final flow rates and any of the remaining budget is used to increase per student expenditure.
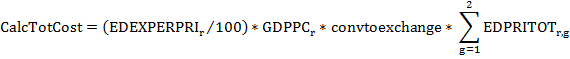
In the equations above, convtoexchange is a factor that converts monetary units from PPP to exchange rate dollars, SpendCostRI is a ratio calculated at the first year of the model to reconcile historical data on aggregate and bottom-up spending.