International Futures at the Pardee Center
International Futures Help System
Education Financial Flow
Financial Flow
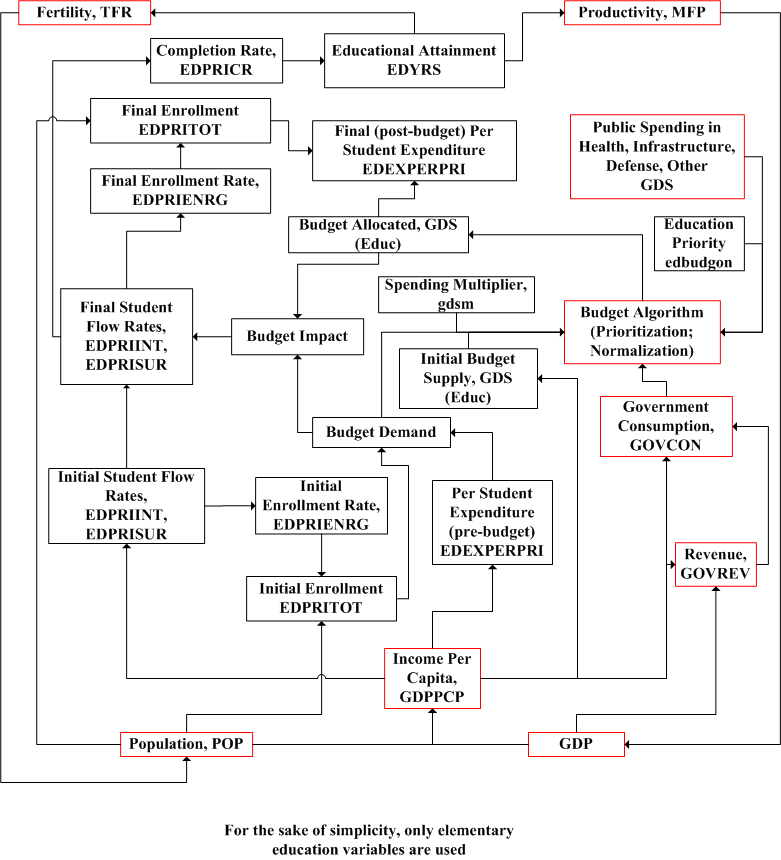
In addition to student flows, and interacting closely with them, the IFs education model also tracks financing of education. Because of the scarcity of private funding data, IFs specifically represents public funding only, and our formulations of public funding implicitly assume that the public/private funding mix will not change over time.
The accounting of educational finance is composed of two major components, per student cost and the total number of projected students, the latter of the two is discussed in the student flows section. Spending per student at all levels of education is driven by average income. Given forecasts of spending per student by level of education and given initial enrollments forecasts by level, an estimate of the total education funding demanded is obtained by summing across education levels the products of spending per student and student numbers.
The funding needs are sent to the IFs sociopolitical model where educational spending is initially determined from the patterns in such spending regressed against the level of economic development of the countries. A priority parameter (edbudgon) is then used to prioritize spending needs over spending patterns. This parameter can be changed by model user within a range of values going from zero to one with the zero value awarding maximum priority to fund demands. Finally, total government consumption spending (GOVCON) is distributed among education and other social spending sectors, namely infrastructure, health, public R&D, defense and an "other" category, using a normalization algorithm.
Government spending is then taken back to the education module and compared against fund needs. Budget impact, calculated as a ratio of the demanded and allocated funds, makes an impact on the initial projection of student flow rates (intake, survival, and transition). The positive (upward) side of the budget impact is non-linear with the maximum boost to growth occurring when a flow rate is at or near its mid-point or within the range of the inflection points of an assumed S-shaped path, to be precise. Impact of deficit is more or less linear except at impact ratios close to 1, whence the downward impact is dampened. Final student flow rates are used to calculate final enrollment numbers using population forecasts for relevant age cohorts. Finally, cost per students are adjusted to reflect final enrollments and fund availability.