International Futures at the Pardee Center
International Futures Help System
Mortality Detail
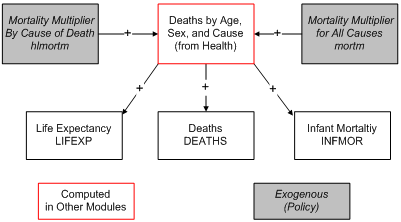
The current default representation of mortality and life expectancy in IFs relies entirely on the health model so please see its documentation. That model computes deaths by age and sex and uses those to compute total deaths (DEATHS) as well deaths by category of cause (DEATHCAT). It also computes life expectancy (LIFEXP) and infant mortality (INFMOR), variables of importance to the population model. Two parameters in the health model allow multiplicative intervention with respect to total deaths ( mortm ) and those by cause ( hlmortm ).
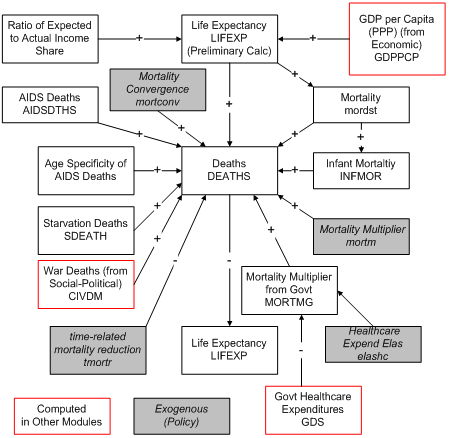
There is, however, a legacy representation of mortality in IFs (available if the health model is switched off with hlmodelsw =0) that reverses that logic and uses the model's calculation of an initial estimate of life expectancy to drive mortality by age and sex (not cause). Life expectancy normally increases and mortality normally decreases as GDP per capita rises (see the economic model) or as the income share of the poorest 20% of the population increases. In the legacy representation, the initial calculation of life expectancy is imposed on an initial the mortality distribution that provides a country-specific age and sex profile of mortality.
A number factors then further affect and alter the mortality distribution in the legacy mortality structure. These include deaths related to warfare (CIVDM), to AIDS, and possibly to starvation (via infant mortality, because it is primarily the very young who are at risk). In addition, the user of the model may introduce greater or lesser mortality via a mortality multiplier.
At the same time, however, increases in life expectancy shift the mortality distribution from its initial condition towards an ultimate life (survivor) table as life expectancy approaches that built into the ultimate life table (approximately 85 in the 1998 revision of the UN population tables).
Once the mortality distribution adjustments are made and deaths can be computed from it, the life expectancy is recomputed.