 International Futures at the Pardee Center
International Futures Help System
Equations: Internal Conflict or War Probability
The PITF defined state failure in terms of four different types of events (with specific magnitude thresholds)—namely, adverse regime change (such as coups), revolutionary wars, ethnic wars, and genocides or politicides (Esty et al. 1998). On the recommendation of Ted Robert Gurr, one of the founding fathers of the PITF data project and approach, IFs builds two categories of insecurity from those four types: instability (adverse regime change); and internal war (combining revolutionary war, ethnic war, and genocide or politicide).
Presence of any one of the three types of war, either as an initiation or continuation, leads us to code a country as 1; otherwise we code the country as 0. This distinction between instability and internal war helps differentiate among what Easton (1965) identified as regime, state, and polity levels within the sociopolitical system, by at least differentiating the regime level (where adverse regime changes occur) from the more fundamental state and polity levels. The forces of change and generally the extent of violence around change differ significantly at these different levels.
Looking at the historical patterns of conflict in global regions across time (see Chapter 4 of Hughes et al. 2014) and doing our own statistical analysis it is clear that the "usual suspect" variables will not explain those patterns, and that in many cases they cannot therefore be very effective in forecasting. We found:
- Normed infant mortality proves statistically interesting, being associated with (explaining or being explained by, using a second-order polynomial form) about 12 percent of cross-country variation in intrastate conflict in the most recent data-year (8.9 percent in panel analysis across the 1960–2000 period). Thus in forecasting it may help us understand general propensity for conflict, but its slow variation over time means it cannot possibly explain the big historical surges of warfare within regions and their country members.
- Trade openness (which we define as the sum of exports and imports as a percentage of GDP) can be helpful in understanding variations in conflict and does vary within countries more rapidly than infant mortality. In cross-sectional analysis with most recent data, infant mortality and trade openness (inverse relationship) together account for 15 percent of the variation in intrastate conflict (trade openness itself is associated with 11 percent of the variance within intrastate conflict in a logarithmic formulation). Moreover, its increase coincides with the reduction of conflict historically within the countries of East Asia. But openness perversely increased over time in South Asia as intrastate conflict also rose. And its statistical power is good but not great. Again, causality could run in either direction or be a spurious result of a third variable; for instance, the end of Indochina wars and a change in economic policy in socialist countries could have led to greater trade there.
- Factionalism, which can have many bases, including ethnicity or the intensity of feelings around ethnicity, is of surprisingly little use in forecasting. Most underlying social divisions change very slowly over time. Although intensity of factionalism around those divisions may change much more rapidly (for instance, as "conflict entrepreneurs" inflame passions), we arguably cannot anticipate when that might happen. Nor do we believe we can we anticipate changes in other potential ideational drivers, such as ideologies. Further, historical measurement of change in factionalism risks using conflict as a proxy, thereby creating the danger that correlations between it and conflict are simply a tautological artifact of that measurement. Finally, our own analysis of various measures of ethnic and/or religious factionalism and intrastate conflict suggests lower relationship than we expected.
- Youth bulges are a potentially more useful driver in forecasting because our demographic forecasts are stronger than those of variables like factionalism or even trade openness, and because demographic structures exhibit clear and non-monotonic variation over time. There were many bulges in East Asia during the 1970s, as there have been many recently in South Asia and as there are today in the Middle East and North Africa. In cross-sectional analysis of recent data, a linear relationship with youth bulge size accounts for 7 percent of the variation in conflict (in panel analysis since 1960, however, only 3.5 percent).
- Consistent with studies that have found anocracy rather than autocracy primarily related to conflict, the relationship of measures of regime type with conflict has an inverted U-shaped character. Using a third-order polynomial, we found that the Polity measure of regime type explains 4 percent of variation in recent intrastate war. The Freedom House measure (see http://www.freedomhouse.org/) actually explains 10 percent, but we used the Polity Project measure (see http://www.systemicpeace.org/polity/polity4.htm) because it is a purer measure of political democracy (rather than civil liberties as well) and because it is our primary measure of regime in forecasting.
- Downturns in economic growth rates preceded the collapse of communism in Europe and Central Asia, the rise of internal conflict in both Latin America and the Middle East in the 1980s, and more recently the events of the Arab Spring. Analysis of the magnitude of downturn required to generate conflict and the lag between downturn and conflict is complex. We found, through experimentation directed at fitting historical conflict patterns (running IFs against historical patterns since 1960), that a 1.0 percent drop in a moving average of economic growth (carrying 60 percent of the moving average forward) is associated with a 0.04 point increase on a 0-1 scale for the rate of internal war.
- Conflict begets conflict. We found, again through historical analysis, a 60 percent carryover of past conflict levels to current ones.
For IFs forecasting, we conceptualize and operationalize intrastate war not as a 0 or 1 outcome as in the data (no war or war), but as a probability of conflict in any country-year. We initialize country probabilities at the beginning of a forecast horizon with average conflict rates across the preceding 20 years. The development of our own basic forecasting formulation for these probabilities involved not just literature and statistical analysis, but testing of the formulation in runs of the model from 1960 through 2010 and comparisons of our historical forecasts with the data on intrastate war. We let the historical forecasts run without the frequently used annual adjustment/correction by the historical conflict data for the full 50 years. We experimented with a number of algorithmic elements in order to improve the historical fit. This analysis yielded the following basic formulation:
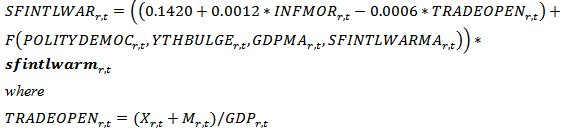
SFINTLWAR=probability of internal war or state failure
INFMOR=infant mortality, normed globally
TRADEOPEN=trade openness ratio
X=exports in billion dollars
M=imports in billion dollars
GDP=gross domestic product in billion dollars
POLITYDEMOC=Polity’s 21-point scale of democracy; asymmetrical curvilinear relationship with a peak at 9 and a sharper fall than rise
YTHBULGE=population age 15–29 as a portion of all adults; algorithmic adjustment with GDP/capita explained in text
GDPRMA=gross domestic product growth rate, algorithmic moving average carrying forward 60 percent past year’s value; algorithmic adjustment with GDP/capita explained in text; inverse relationship
SFINTLWARMA=moving average of past internal war probability (i.e., carrying forward past forecast values, not past data values)
sfintlwarm=an exogenous multiplier for scenario analysis
Algorithm on regional contagion explained in text
R-squared = 0.22 in 50-year historical simulation without annual correction (see text for elaboration)
Our historical and extended analytical explorations of the core statistical formulation with infant mortality and trade openness led us to make a number of algorithmic changes to it in creating our basic formulation. We found that $18,000 per capita (in 2005 dollars at PPP) is a point above which economic downturns and youth bulges tend not to increase the probability of internal war, so we greatly dampened the affects of both of those variables above that level. We also found it important to add a regional contagion effect; courtesy of data provided by Paul Diehl we combined three of the Correlates of War Project distance categories (contiguous, less than 12 miles separation, and less than 24 miles separation) and added 0.1 to conflict probability for a country for each neighbor with computed conflict probability of its own above 0.2— because of conflict carryover across time, this algorithm can also lead to a positive feedback loop of neighborhood contagion.
We further found that the intrastate war formulation is sensitive to actual GDP levels, not just because of the growth rate term, but because within the broader IFs system GDP per capita also affects the endogenously calculated youth bulge and democracy variables (we will return to discussion of the latter). To deal with this sensitivity, we forced the IFs historical base to be historically accurate with respect to GDP growth—otherwise the entire historical forecast of IFs after 1960 was endogenously determined in recursive annual calculation only by initial conditions and formulations rather than with annual corrective terms often used in historical validation exercises.
This basic initial formulation generated a pattern of historical forecasts (which can be generated using the file HistoricalNoMassRepOrExtInterv.sce) of intrastate warfare probabilities that showed some of the characteristics of the historical data, including a peak for the Middle East and North Africa in the 1980s and one for developing Europe and Central Asia in the early 1990s (both related to growth downturns). Visual comparison quickly suggested, however, that the overall pattern was not a good historical fit. In particular, the bulges of conflict in East Asia in the early years and of South Asia more recently were missing; in addition, because of the infant mortality and economic growth terms, the model generated a bulge of conflict within Africa in the early 1980s (when growth and social advance was very weak) that did not appear in the data. Moreover, statistically, the forecasts correlated at the region level with data across the 1960-2010 time period with only a 0.19 R-squared level.
We therefore explored the bases of the historical patterns further, and concluded that additional factors were missing. One is the extreme or totalitarian repression that lowered conflict in developing Europe and Central Asia until about the time of General Secretary Mikhail Gorbachev; we added a repression parameter (wpextinterv) for exogenous manipulation. More controversially perhaps, we also found it necessary to extend the suppression of conflict to sub-Saharan Africa in the middle period of the historical run; the underlying assumption is that the domestic prestige and power of liberation movement leaders, backed by their domestic and superpower supporters, helped dampen conflict significantly in the face of poor, and even deteriorating, domestic economic and social conditions.
A second type of factor missing in our basic statistical analysis is external interventions, such as those of the U.S. in Southeast Asia in the 1960s and those of the former USSR and then the U.S. in South Asia after 1980; we added another exogenous parameter (sfmassrep) to represent such interventions.
Although still not a terribly strong match to actual history, this revised historical forecast some remarkable similarities, including the initially high level of conflict in East Asia and the Pacific and a relatively high rate for South Asia in recent decades. The adjusted R-squared rises to 0.61 from 0.19 (before the addition of the repression and intervention variables). The major problems that remained in our historical forecast include the generation by the model of too much conflict for Latin America and the Caribbean in the 1980s, when economic and social conditions in that region deteriorated significantly; and the relatively high levels of conflict in sub-Saharan Africa beyond the end of the Cold War, again associated in our forecast with a combination of absolute and relative deterioration in socioeconomic conditions of many countries. Thus the additional parameters may be useful in scenario analysis.
It is possible that our relatively high historical forecasts for conflict in post-Cold War sub-Saharan Africa, even after formulation enhancements, may reflect the remaining omission of yet another systemic variable, namely regional and global efforts to dampen conflict there. There is no parameter to represent that variable, but the user can use the overall multiplier ( sfintlwarm ) in scenario analysis.