International Futures at the Pardee Center
International Futures Help System
Cross-sectional Analysis of Change in Poverty
Although the dominant approach to forecasting poverty in IFs used the lognormal formulation, a simpler approach is also possible using a cross-sectional estimation of the relationship between poverty and GDP per capita at PPP. This simpler approach was developed for IFs before the lognormal one and has been retained as a useful second estimate of future poverty. In addition, in the pre-processor the cross-sectional formulation is used to fill holes for countries without surveys in estimating initial poverty rates (even when forecasts then go on to use the logarithmic approach). Not surprisingly, the cross-sectionally estimated function uses the same proximate driving variables as the lognormal function, namely GDP per capita at PPP (GDPPCP) and domestic Gini (GINEDOM). A scaling factor computed the first year (IncomeLT1RI) assures that the value computed in the first year matches data; the factor is maintained in the calculation over time. The formulation for poverty at $2.00 per day (INCOMELT2CS) uses the same formulation.
![]()
where
![]()
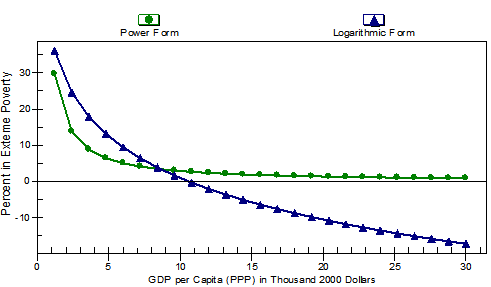
As with other functions used in IFs, we experimented with many variations before determining which to use in the model. The figure below shows the relationship between GDP per capita at PPP and poverty using both an exponential or power curve and a logarithmic form; both produce approximately the same R-squared. The logarithmic form is normally used in IFs, because it appears visually to capture better both the higher levels of poverty at low levels of GDP per capita and to capture the near elimination of extreme poverty by about $10,000 per capita.