 International Futures at the Pardee Center
International Futures Help System
Advanced Sustainability Analysis
The Advanced Sustainability Analysis (ASA) is a framework developed by the Finland Futures Research Centre (FFRC), and the partial implementation in IFs was in cooperation with the FFRC within the TERRA project. For further information on ASA see: Kaivo-oja, Jari, Jyrki Luukhanen, and Pentti Malaski (2002). "'Methodology for the Analysis of Critical Industrial Ecology Trends: an Advanced Sustainability Analysis of the Finnish Economy' " Turku, Finland: Finland Futures Research Centre.
The ASA builds on resource use or emissions calculations such as those for annual carbon emissions. The implementation in IFs represents four different environmental impact areas:
- Fossil fuel use
- Carbon emissions
- Deforestation
- Water use
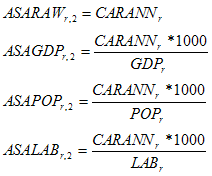
The raw values for each environmental impact are put into the ASA raw value matrix (ASARAW), drawing upon variables from elsewhere in IFs.

Within each area there are four environmental impact views, including the raw impact view shown above. The views are:
- Raw values of impact (e.g. ASARAW, 2 for raw carbon emissions)
- Impact per unit of GDP (e.g. ASAGDP, 2 for carbon emissions per unit of GDP)
- Impact per unit of population (e.g. ASAPOP, 2 for carbon emissions per unit of POP)
- Impact per member of the labor force (e.g. ASALAB, 2 for carbon emissions per unit of LAB)
The equations below illustrate those for views, using carbon emissions. The other three sets for the other three impact areas would be completely parallel.
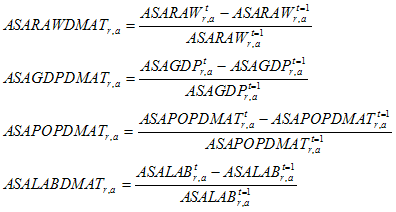
In addition, there are calculations within each view of dematerialization over time. Dematerializations are calculated within each impact area (a) relative to raw impact (ASARAWDMAT), to GDP (ASAGDPDMAT), to population (ASAGDPDPOP), and to labor (ASAGDPDMAT)
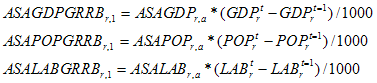
Gross rebounds are also calculated for the ASA system. They are basically the raw impact times the growth in either GDP, population, or labor.
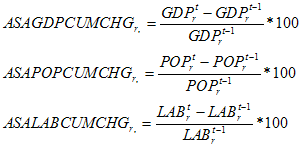
Finally, there are three measures of cumulative change created for the display system, once for each of the GDP, population, and labor bases of the system.
It is recommended that the model user look at the specialized display for ASA in order to see the variables of the ASA system most easily.