International Futures at the Pardee Center
International Futures Help System
Education Student Flow
Student Flow
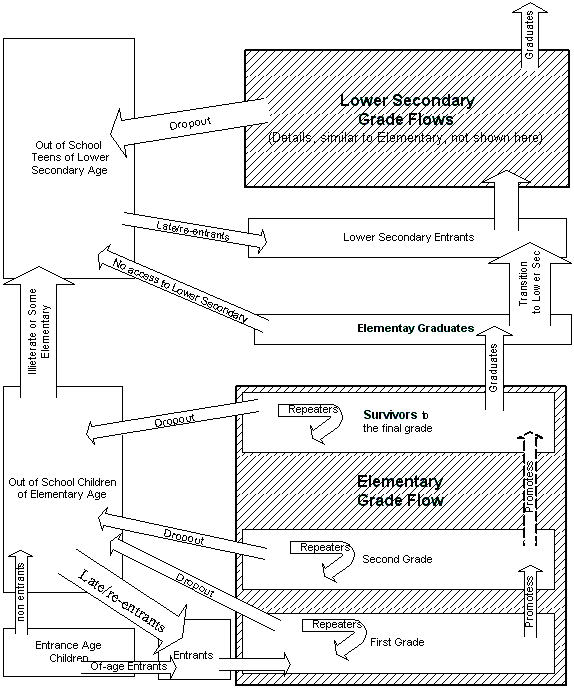
IFs education model simulates grade-by-grade student flow for each level of education that the model covers. Grade-by-grade student flow model combine the effects of grade-specific dropout, repetition and reentry into an average cohort-specific grade-to-grade flow rate, calculated from the survival rate for the cohort. Each year the number of new entrants is determined by the forecasts of the intake rate and the entrance age population. In successive years, these entrants are moved to the next higher grades, one grade each year, using the grade-to-grade flow rate. The simulated grade-wise enrollments are then used to determine the total enrollment at the particular level of education. Student flow at a particular level of education, e.g., primary, is culminated with rates of completion and transition by some to the next level, e.g., lower secondary.
The figure below shows details of the student flow for primary (or, elementary) level. This is illustrative of the student flow at other levels of education. We model both net and gross enrollment rates for primary. The model tracks the pool of potential students who are above the entrance age (as a result of never enrolling or of having dropped out), and brings back some of those students, marked as late/reentrant in the figure, (dependent on initial conditions with respect to gross versus net intake) for the dynamic calculation of total gross enrollments.
A generally similar grade-flow methodology models lower and upper secondary level student flows. We use country-specific entrance ages and durations at each level. As the historical data available does not allow estimating a rate of transition from upper secondary to tertiary, the tertiary education model calculates a tertiary intake rate from tertiary enrollment and graduation rate data using an algorithm which derives a tertiary intake with a lower bound slightly below the upper secondary graduation rate in the previous year.