 International Futures at the Pardee Center
International Futures Help System
Equations: Water and Sanitation Infrastructure
Percentage of population with access to improved drinking water and sanitation
For access to water and sanitation, we use a nominal logistic model to determine the share of the population in each category of access. For both water and sanitation, the number of categories is 3. For water these are no improved access, other improved access, and piped; for sanitation they are other unimproved access, shared access, and improved access.
The values pi shown below represent the share of population with access to each of these categories. The resulting values of piwill all fall between 0 and 1 and sum to 1. These are then multiplied by100 in order to obtain values that range between 0 and 100 and sum to 100.
![]()
for i = 1 to 2
and
![]()
where
![]()
for i = 1 to 2
n is the number of explanatory variables
| Estimated coefficients | |||||
| Intercept | EDYRSAGE25 r,t | GDPPCP r,t | INCOMELT1CS r,t / POP r,t * 100 | GDS(health) r,t / GDP r,t * 100 | |
| Water | |||||
| s0 | 0.47200933 | -0.4414453 | -0.7033376 | 0.0253734 | -0.1616335 |
| s1 | 1.17414971 | 0.13867779 | -1.1508133 | 0.01181508 | -0.2769033 |
| Sanitation | |||||
| s0 | 0.73081107 | -0.6420051 | -0.4497351 | 0.02170283 | -0.1562885 |
| s1 | -2.1593291 | 0.22539909 | -0.3555466 | 0.02823687 | -0.1579957 |
EDYEARSAGE25 = mean years of education for adults over the age of 25, in years
GDPPCP = gross domestic product per capita at purchasing power parity in thousand constant 2005 dollars
INCOMELT1CS = population with income less than $1.25 per day, cross sectional computation in millions
POP = total population in million persons
GDS(health) = government expenditure on health in billion constant 2005 dollars
GDP = gross domestic product at market exchange rates in billion constant 2005 dollars
- additive shift factors: WATSAFEshift and SANITATIONShift; converge over watsanconv years for high and low categories; for intermediate categories, convergence time is 20 years for positive shift factors and 50 years for negative shift factors
- multipliers; watsafem and sanitationm
- targeting parameters: sanitationtrgtval, sanitationtrgtyr, sanitnoconsetar, sanitnoconseyrtar, sanitimpconsetar, sanitnoconsetar, sanitnoconseyrtar, watsafetrgtval, watsafetrgtyr, watsafehhconsetar, watsafeimpconsetar, watsafenoconsetar, watsafenoconseyrtar,
- hold switches: watsafhldsw and sanithldsw, , fixes value of WATSAFE and SANITATION at initial year value
- values are normalized so that the three categories for water and sanitation each sum to 100
- pooled cross-sectional data, nominal logistic regression, R-squared = 0.85 for safe water, 0.87 for sanitation
Percentage of population with wastewater collection
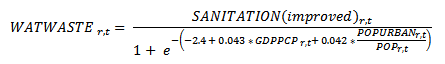
WATWASTE = percent of population with wastewater collection, in percentage
SANITATION(improved) = percent of population with access to improved sanitation, in percentage
POPURBAN = urban population in million persons
POP = total population in million persons
- uses extrapolative formulation – coefficients are hard coded
- additive shift factor: WatWasteColShift; converge upward over 25 years, downward over 250 years
- multiplier: watwastem
- no targeting parameters
- value is not allowed to exceed SANITATION(improved)
- value is not allowed to decline in the absence of a target or multiplier or lack of finance for maintenanc
- pooled cross-sectional data, OLS regression with country random effect, R-squared = 0.34
Percentage of population with wastewater treatment
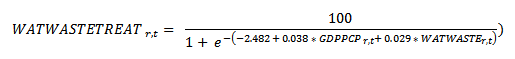
WATWASTETREAT = percent of population with wastewater treatment, in percentage
WATWASTE = percent of population with wastewater collection, in percentage
GDPPCP = gross domestic product per capita at purchasing power parity in thousand constant 2005 dollars
- additive shift factor: WatWasteTreatShift; converge upward over 25 years, downward over 250 years
- multiplier: watwastetreatm
- targeting parameters: watwastetreatsetar. watwastetreatseyrtar (no targeting parameters for absolute targets)
- value is not allowed to exceed WATWASTETREAT
- value is not allowed to decline in the absence of a target or multiplier or lack of finance for maintenance
- pooled cross-sectional data, GLM regression, R-squared = 0.59