 International Futures at the Pardee Center
International Futures Help System
Distal Driver Formulation
Overview
For the basic forecast of mortality related to most of the major cause clusters (exceptions are deaths from HIV/AIDS and traffic accidents) we use the regression models and associated beta coefficients prepared for the Global Burden of Disease project (Mathers and Loncar 2006). Age, sex, cause, and country-specific mortality rate is a function of income, adult education, technological progress, and (in specific cases) smoking impact:
![]()
M is mortality rate in deaths per 100,000 for a given age category c, sex p, cause of death d and country or region r.
Y is GDP per capita at PPP
HC (human capital) is Years of Adult Education over 25
T is time
SI is Smoking Impact
Income and education (IFs variables GDPPCP and EDYRSAG25, respectively) are forecast endogenously in IFs. Time, a proxy for technological progress, is calculated as calendar year minus 1900 (for example, T for the year 2001 equals 101). Smoking impact, a variable meant to capture historical smoking patterns, is included only in the forecasts of mortality related to malignant neoplasms, cardiovascular disease, and respiratory disease. [1] As described in another section of this document, IFs uses both historical smoking rate estimates and SI projections to 2030 (as provided by GBD authors) to forecast the SI variable.
Using an historical database representing mortality data from 106 countries for the years 1950-2002, the GBD calculated sex-specific regression coefficients for seven age groups (<5, 5-14, 15-29, 30-44, 45-59, 60-69, and 70+) and ten major cause clusters–the first ten in the list above (Protocol S1, 1-3). [2] GBD estimations using the data from the 106 countries created separate low- and high-income regression models (not coefficients for each country separately), with low income defined as GDPPCP < $3,000 in the initial year. Both sets of coefficients are publicly available online. [3] In IFs we spread the coefficients for the seven age groups across 5-year subcategories; that is, we use the same coefficients for each subcategory within the larger GBD ones–normalization of mortality within each 5-year subcategory across causes and to total mortality rates for each subcategory (taken from UN Population Division data) does, however, create differences in mortality rates across those 5-year groupings.
We generally use the beta coefficients provided by GBD authors to forecast mortality related to six cause groups: Group I excluding detailed communicable causes, malignant neoplasms, digestive diseases, Group II excluding diabetes and mental health, other intentional injuries, and intentional injuries. However, for a few age and Group III cause groups where regression models provided low predictive value, we also follow the GBD in keeping mortality rates constant over time instead of using the regression equations. Affected groups include: unintentional injuries for males older than 70; unintentional injuries for females older than 60; intentional injuries for males and females under 5; intentional injuries for males older than 60; and intentional injuries for females older than 45.
Although we forecast mortality by age, sex, cause, and country as in the general GBD equation above (and the details can be seen in the specialized displays of the model on mortality by age, sex, and cause and the mortality J-curve), the major model variable for display is DEATHCAT, which is total deaths by country/region, cause, and sex. The equation for it, using the IFs variables for GDP per capita at PPP (GDPPCP), average years of education for adults aged 25 and older (EDYRSAG25), time (IY%), and smoking impact (HLSMOKINGIMP) is
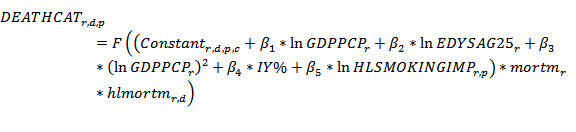
The betas in the equation, as indicated earlier, are from the GBD work and are dimensioned also by country/region r (only as high income or low income), cause of death d, sex p, and age category c. The entire equation for mortality is adjusted in an algorithmic process so that the total across all causes of death equal the mortality rates from the UN Population Division’s data (using a normalization factor), while the relative weights for each disease match WHO data (using a scaling factor). The normalization and scaling factors are multiplicative, affecting everything in the equation. In the Base Case scenario we keep those factors constant, but we can control convergence of them (see the Normalization and Scaling Factors section).
The equation allows scenario modification with multiplicative parameters that change mortality overall ( mortm ) or by cause of death ( hlmortm ). Not shown in the equation, hlmortcdchldm changes the rates of all communicable diseases for children aged 5 and younger, while hlmortcdadltm affects rates of death from communicable diseases for adults aged 15-49.
[1] See Protocol S1, Mathers and Loncar 2006 for more detail on the use of smoking impact in GBD projections.
[2] See Table 1, Protocol S1, for the cause clusters used in the GBD 2002 and 2004 projections. IFs does not use GBD coefficients for HIV/AIDS, relying instead on a structural model; mental health mortality is kept at a constant rate and coefficients for the other three communicable diseases (diarrhea, malaria, and respiratory infection) come from other sources.
[3] For regression results, see Tables S3 and S4 at http://www.plosmedicine.org/article/info%3Adoi%2F10.1371%2Fjournal.pmed.0030442#s5.