International Futures Help System
Cars and Trucks: Approach 2 (Total)
As the equations elaborate, there are two general approaches and four specific options for determining the annual demand of countries/regions for cars and trucks and therefore the annual new sales of those vehicles.
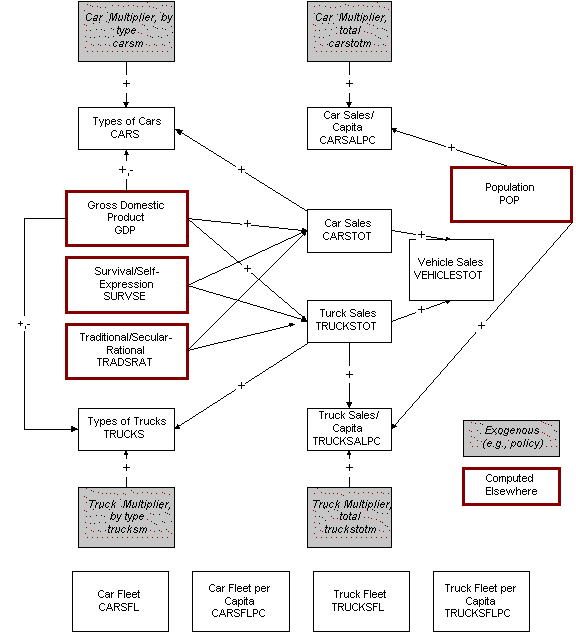
GDP per capita at purchasing power parity is the primary driver of sales per capita in most of those options. It is also possible, however, to have car/truck sales driven directly by GDP, which is the logic portrayed below. The specific logic/formulation depends on the value of the vehicle function switch (vehfuncsw). When the value is 2, sales are driven directly by GDP, as shown here. In addition, sales are affected by country/region values on the traditional/secular-rational value dimension. Although the model does not include the survival/self-expression dimension in this particular logic (estimated functions did not show it adding much predictive power), the causal diagram portrays it as a possible driver.
Functions that indicate whether individual types of cars or trucks are "inferior" or "superior" goods, that is whether then decrease or increase with incomes, then determine how total car and truck sales are split across individual categories of cars and trucks.

Future development may focus not just on annual car and truck sales, but on the fleets of each. Variables for fleet size and per capita fleet size are therefore shown above, but not yet used.
 International Futures at the Pardee Center