 International Futures at the Pardee Center
International Futures Help System
Equations: Vulnerability to Conflict (and Performance Risk Analysis)
The second approach to analyzing risk of violent internal conflict (and broader country risks) involves the creation of indices that tend to rank states according to generalized performance. The projects creating such indices—variously referred to as measures of state fragility, state weakness, political instability, or failed states—most often do not intend to convey a probability of violent internal conflict. Rather they try to suggest greater or lower propensities for conflict as well as broader country risk, for instance that which foreign investors might face with respect to socioeconomic conditions. .
Generally, these indices combine variables in four categories: social, political, economic, and security. Developers may supplement variables that mostly focus on the average values for countries with select variables focusing on distribution (such as the Gini index). They commonly weight variables within categories equally and/or weight the categories equally when aggregating them to final index values. While individual variables have theoretical and empirical links to conflict or lack of security, such simple combination of large numbers of highly intercorrelated variables into a formulation of conflict vulnerability is very difficult to interpret. Moreover, because reports generally present an index with no simple interpretation of scale, analysts focus heavily on rankings of countries.
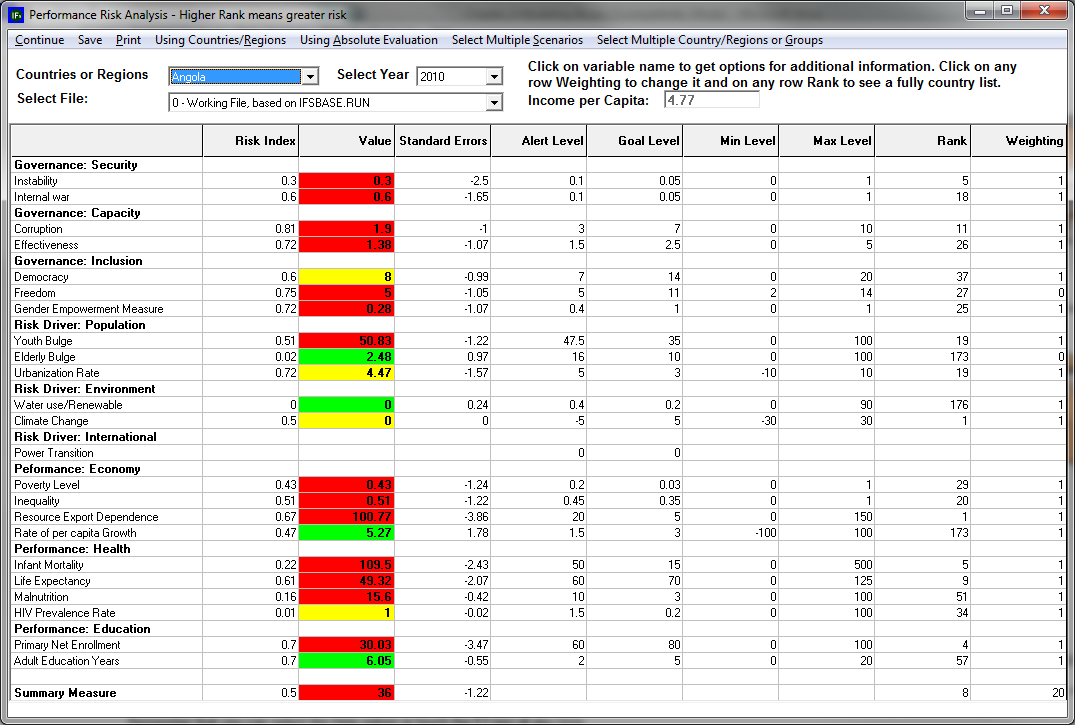
The IFs project has created its own Performance Risk Index (see variable GOVRISK) along the lines of these approaches, and for the purposes of forecasting has uniquely made it responsive to endogenous long-term change in the underlying variables. Like those of other projects, the IFs measure draws upon social, political, economic, and security variables, but we impose a different conceptual or analytical structure on them (see the example risk analysis form provided here). We divide the variables of the index into three general categories: governance, (deep) risk drivers, and performance. We further divide the governance variables into our three dimensions of security, capacity and inclusion, the deep risk factors into demographic, environmental, and international categories, and the performance factors into economic, health, and education categories.
The Performance Risk Index (GOVRISK) and the probability of intrastate conflict (SFINTLWAR) provide quite different images of security in states, in part because the probability of intrastate war has a power-law distribution across countries and risk indices have a more nearly linear distribution (see Chapter 2 of Hughes et al 2014). In 2010 the correlation between the two measures in IFs has an adjusted R-squared of only 0.25. Presumably the probability of conflict measure should be the better indicator of its likelihood. In fact, beyond their drawing our attention to the highest ranked and therefore most fragile countries, risk indices seldom are used to identify conflict likelihood and more often suggest a wider variety of risks, including overall poor state performance, only some of which may be so severe as to lead to conflict.
Because vulnerability or risk indices often include GDP per capita or other highly correlated indicators, they generally assign greater risk to poorer countries. Another way of using such risk information it to compare performance of countries to expectations that control for their level of GDP per capita (with a cross-sectional analysis). The column in the Performance Risk Analysis form showing standard errors helps us do that. In 2010 Angola's performance on infant mortality was 2.4 standard errors worse than the expected value. Thus its performance on that variable was not only very poor relative to other countries around the world, but also relative to countries at its own income level.
Unlike our analysis with the probability of conflict, it is not possible to compare the IFs Governance Risk Index with other measures across the full 1960–2010 historical time period, because those other measures tend to be quite recent and to cover only a small number of years. For instance, the Brookings Institution's Index of State Weakness for the Developing World (Rice and Patrick 2008) was produced only for a single year (2008). The measures with the greatest time series are the Fund for Peace's Index of State Failure (2005–2012) and the Center for Systemic Peace's (CSP's) State Fragility Index (1995-2011); see Marshall and Cole 2008; 2009; 2011). In order to assess the risk index of IFs, we again did a historical run of the model, without any extraordinary interventions, from 1960 through 2010—the run computes the IFs Country Performance Risk Index for all years. The R-squared of 0.71 indicates the remarkably close correlation, even after 50 years of forecasting with the full integrated IFs model. In fact, the R-squared is 0.70 across all years for which the SFI is available.
For much more detail on the structure and computations of the Performance Risk Analysis form, see the separate discussion of it (see Performance Risk Analysis Form).