 International Futures at the Pardee Center
International Futures Help System
Equations: Diabetes
To forecast diabetes, IFs uses the following formula:
![]()
Mr,c,d=Diabetes,p,r is diabetes-related mortality by country/region r, age category c, and sex p.
ONCDr,c,p is other Group II (non-communicable disease) mortality, derived using the basic distal driver equation . HLDIABETESRRr,c,p is a “Diabetes Relative Risk” factor, explained below.
In a population at the “theoretical minimum” level of body mass index (BMI), where BMI is 21, diabetes-related mortality is expected to fall at 75 percent of other Group II mortality. [1] The diabetes relative risk factor (HLDIABETESRR) captures the increased risk represented by a population above the theoretical BMI minimum level. For example, the factor is about 1 for young females in Vietnam (where BMI is close to the theoretical minimum level of 21). Comparatively, the RR is approximately 28 for middle-aged women in the United Kingdom where population BMI is much higher. [2]
The GBD project projected the RR variable for diabetes out to 2030 using fairly involved estimates of age and sex-specific levels (plus standard deviations) of population BMI. Our estimates in IFs of future BMI (HLBMI) are less sophisticated, and we only forecast country/region (r) and sex-specific (p) mean BMI (see this section for a description of our forecasts of BMI). As such, while we endogenize the RR variable by tying it to our forecasts of BMI, we also adjust our forecast by initializing RR using the GBD estimates for the year 2010 and computing an age-category specific shift factor (HLDIABSHIFT) in order to tie our forecast of expected RR with GBD estimates.
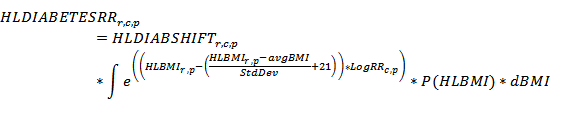
The RR for diabetes forecast in IFs (HLDIABETESRR) assumes that country-specific BMI is distributed normally, and also assumes a standard deviation of 10% of the mean: [3]
[1] The slower decrease in diabetes-related mortality reflects assumptions that risk factors for diabetes will improve more slowly that risk factors for other Group II diseases (Protocol S1, 6).
[2] All RRs available in the IFs system, variable name HLDIABETESRR.
[3] We recognize, of course, that BMI is most likely not distributed normally in a population. However, we follow CRA authors in assuming normality in order to compare a given population with an ideal counterfactual population (James et al 2004).
[4] WHO Comparative Risk Assessment Methodology, Kelly et al, 2009
[5] See associated data table, Kelly et al 2009.
[6] avgBMI is our forecast of BMI, while BMI are the values from -3 standard deviations to +3 standard deviations away from that avgBMI. Cecilia Peterson determined the fixed 10 percent rate for StdDev from the literature.